Week 5 - Probability and Electoral Votes
Monday, October 12, 2020
“The most important office, and the one which all of us can and should fill, is that of private citizen.” ― Louis Brandeis, Former Associate Justice of the Supreme Court of the United States
Introduction
This week, we take a different approach than the typical linear regression model fitting approach we have been following for the last few weeks. Instead, we employ Binomial logistic regression and think of the election outcome for Democrats as a finite draw of voters from the voter-eligible population (VEP) turning out to vote Democrat, modeled as a binomial process.
Simulating a distribution of election results
The vote total for any particular candidate in the presidential election has a fixed set of possible values: 0 − VEP, where VEP is the voter eligible population for the presidential election in question. Let’s say we’re interested in the popular vote total for the Democratic nominee in some state s. Thus, the election outcome for Democrats in state s is some draw of voters from the voter-eligible population (VEPs) turning out to vote Democrat. We call this process of draws from a population (often called successes from a number of trials) a binomial process.
The core probabilistic phenomena driving a binomial process is whether or not a single voter, denoted by i, will turn out and vote for the party in question. Let’s call this individual voter probability in state s. The question we can ask is: what, then, is the probability of n voters voting for the Democratic presidential nominee in this state? It turns out that this question can be answered by setting up a distribution that follows the Binomial distribution.
Model Implementation
To improve our probabilistic model, and account for any model outliers, instead of a calculating the probability for a single Democratic voter showing up tot he polls and voting for the Democratic presidential nominee, or the single expected number of Democratic voters from the population, we predict a distribution of Democratic voter draws from the respective binomial process on that population.
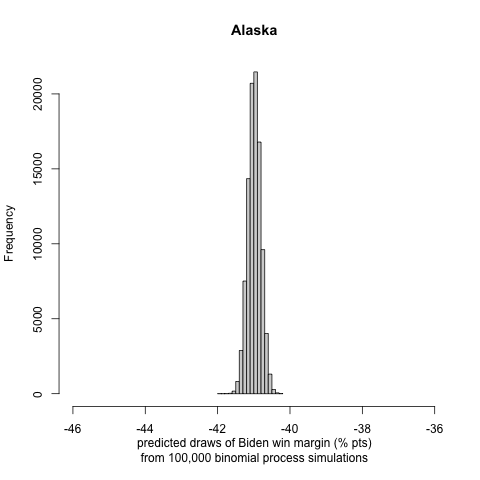
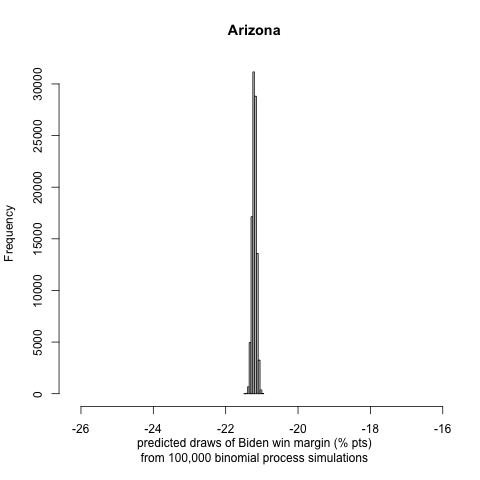
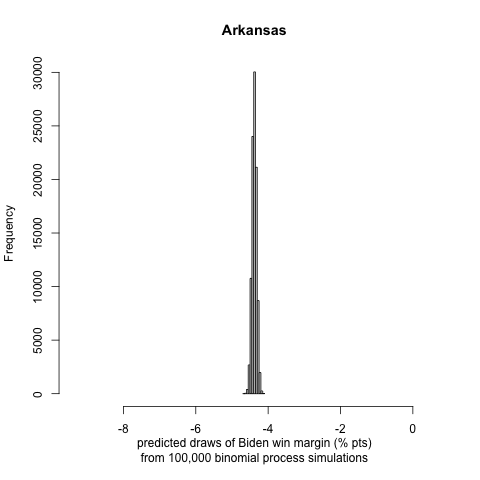
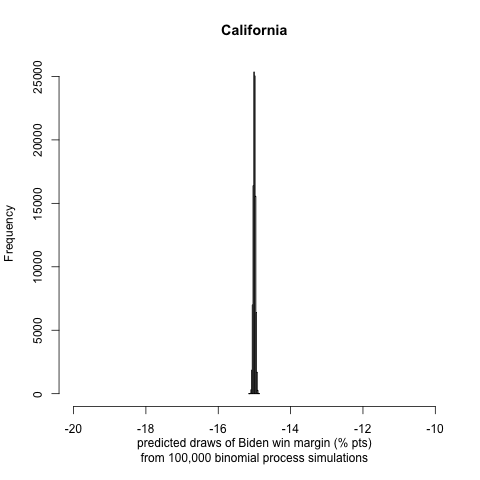
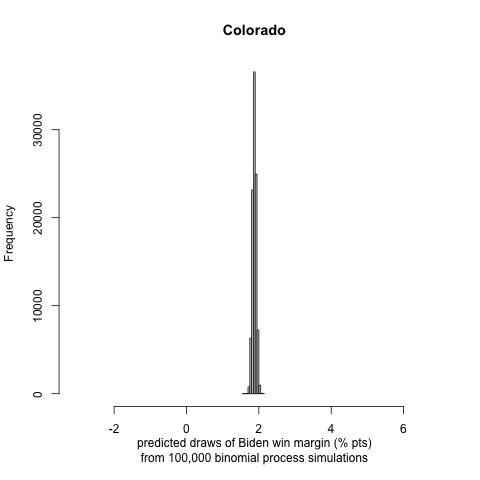
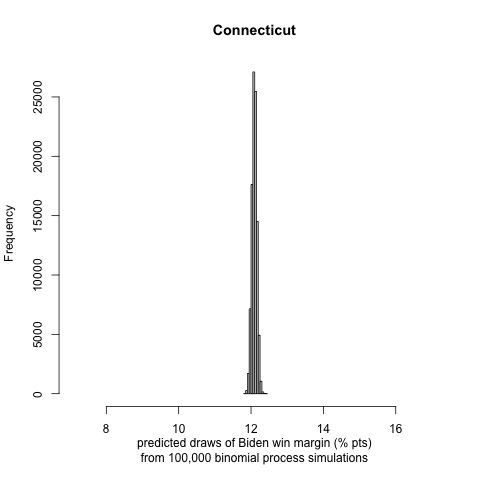
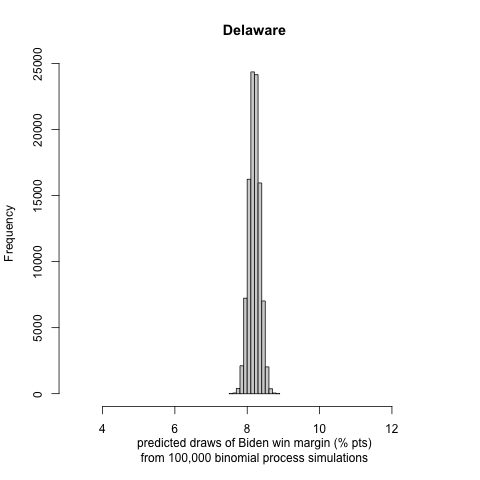
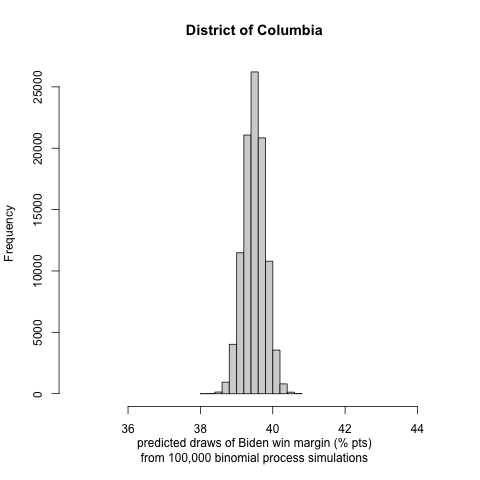
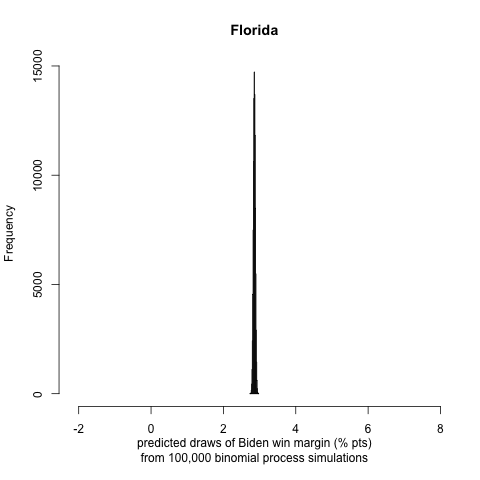
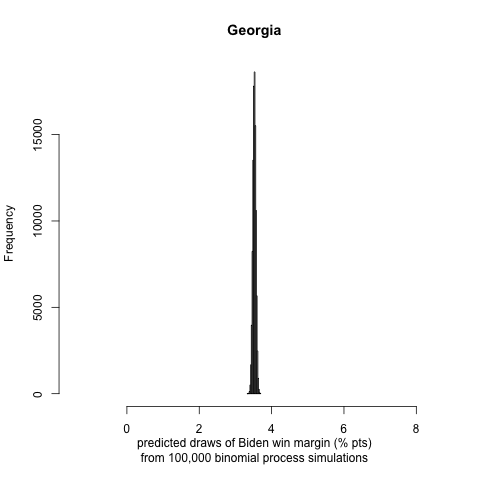
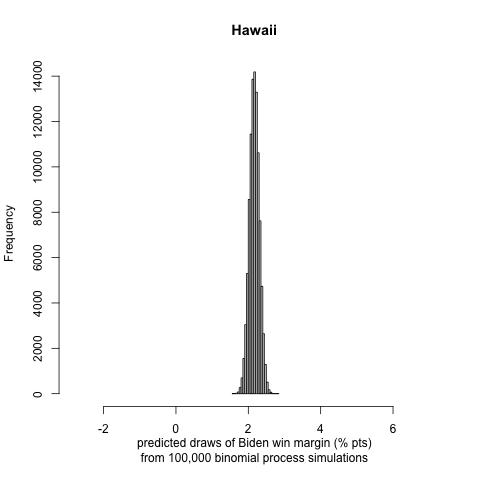
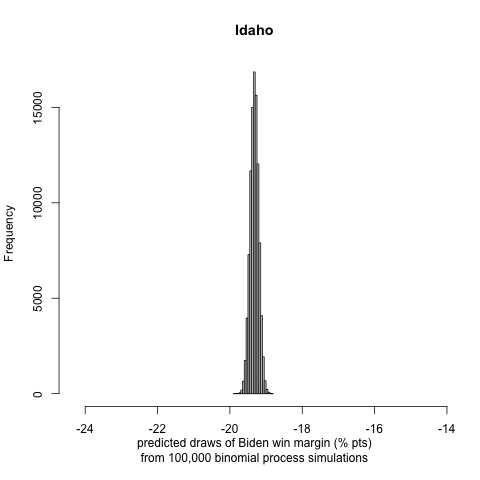
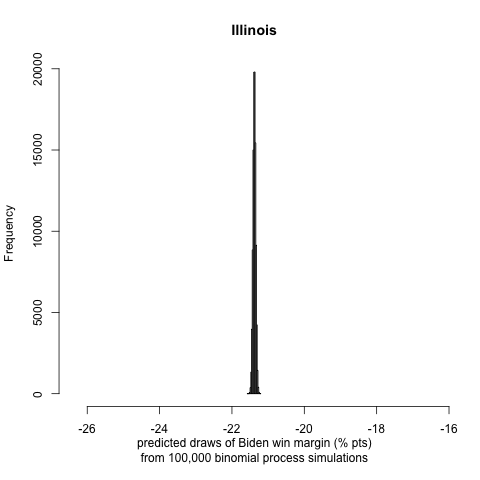
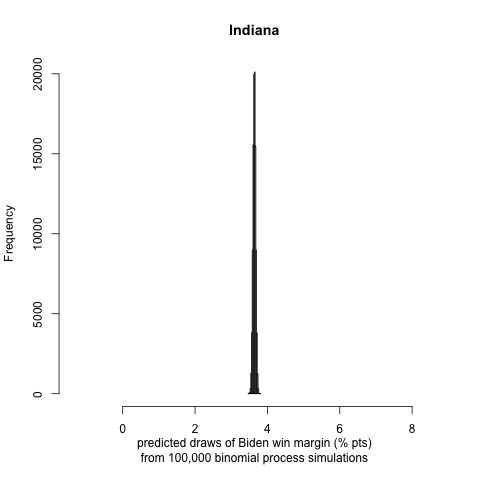
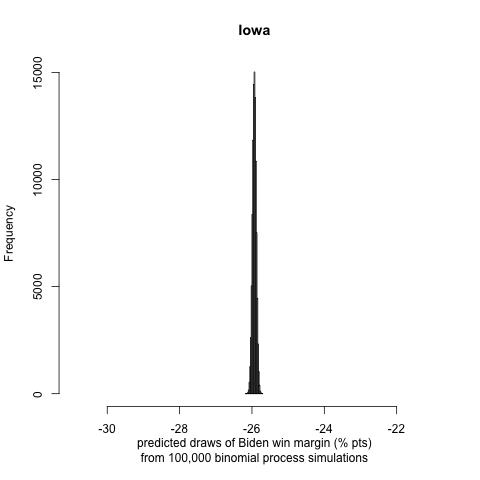
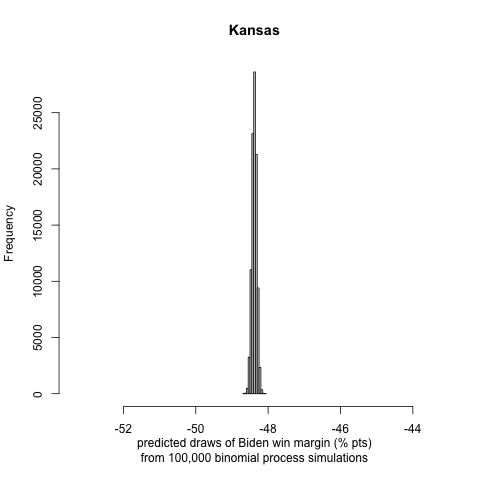
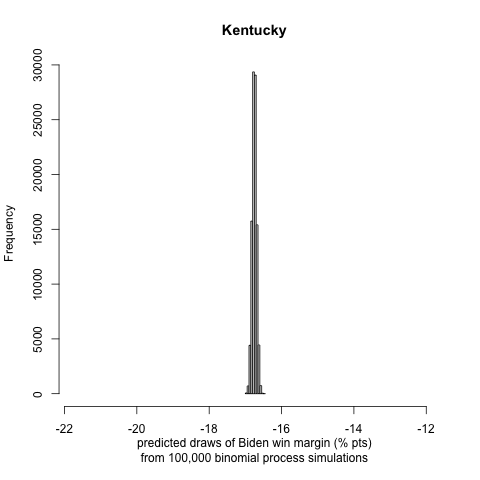
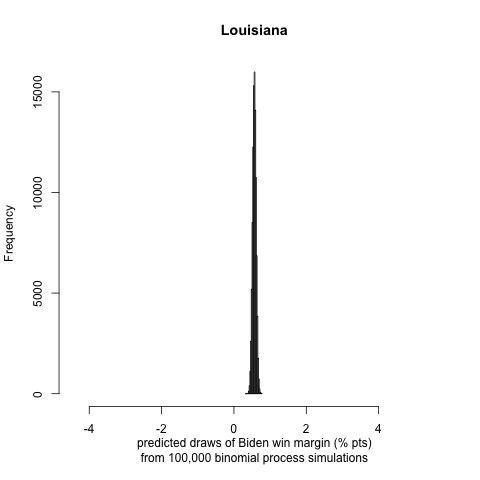
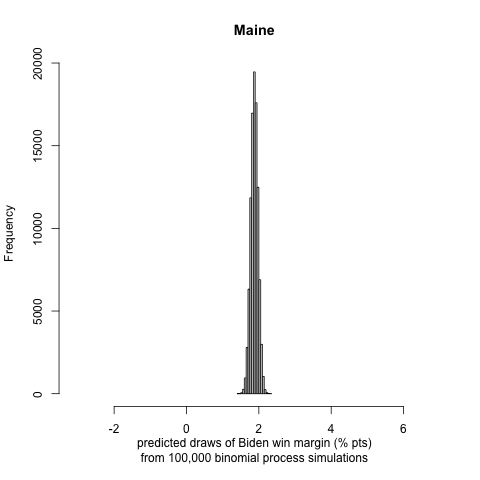
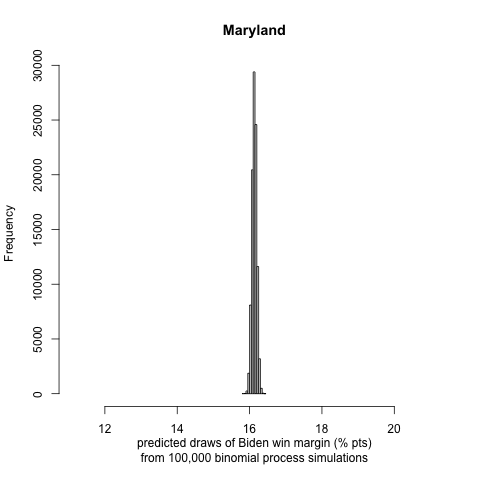
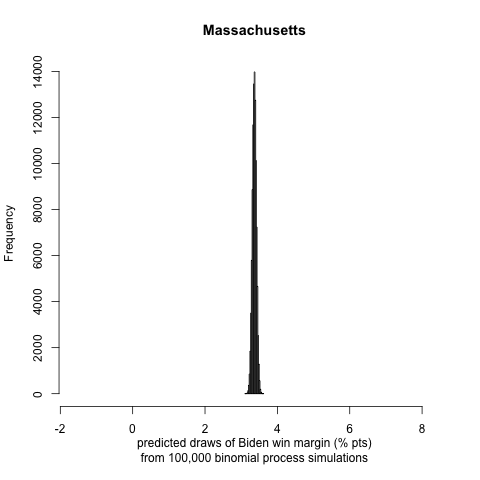
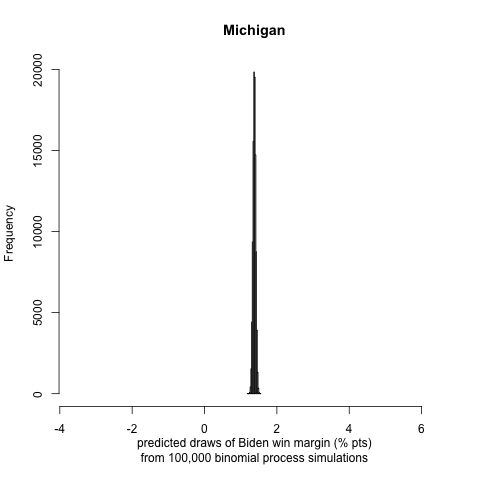
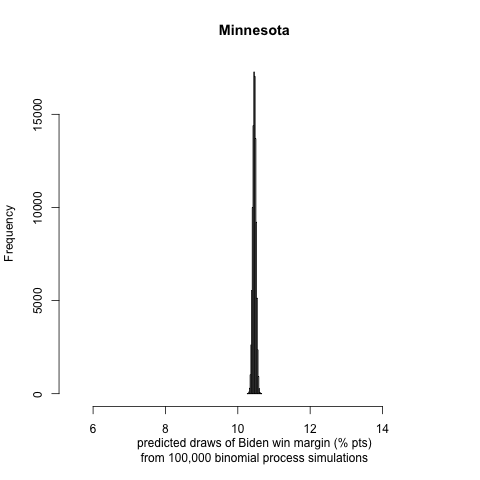
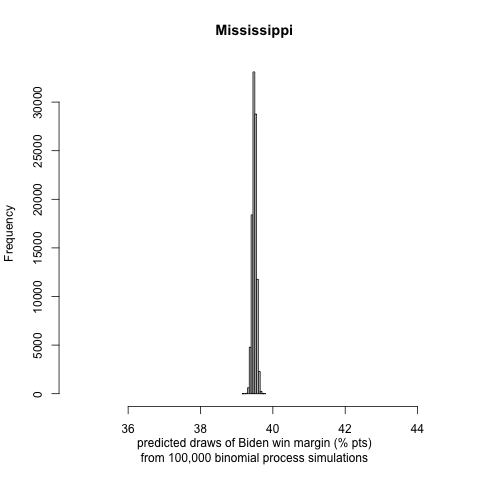
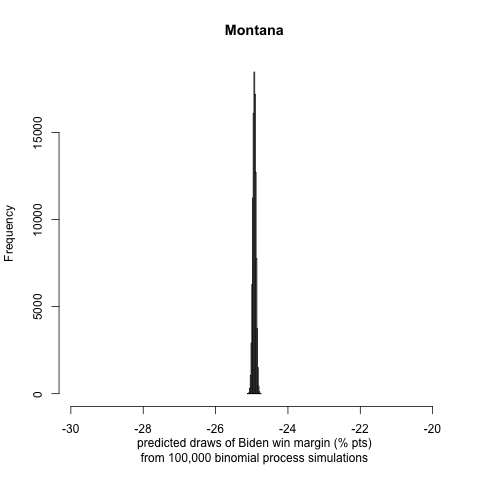
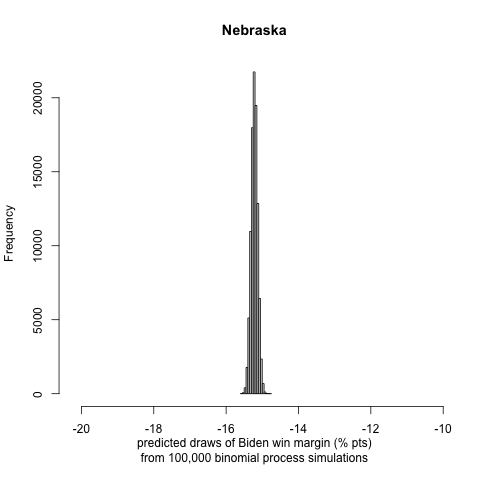
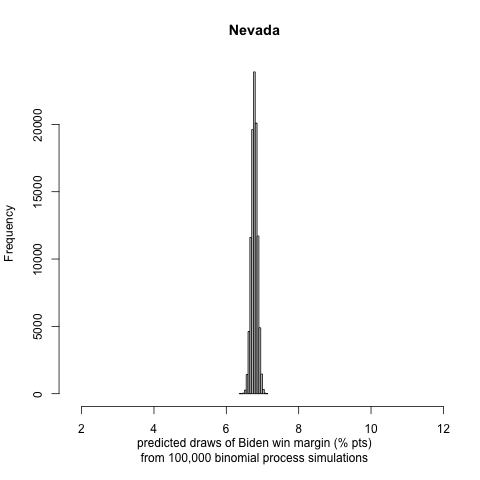
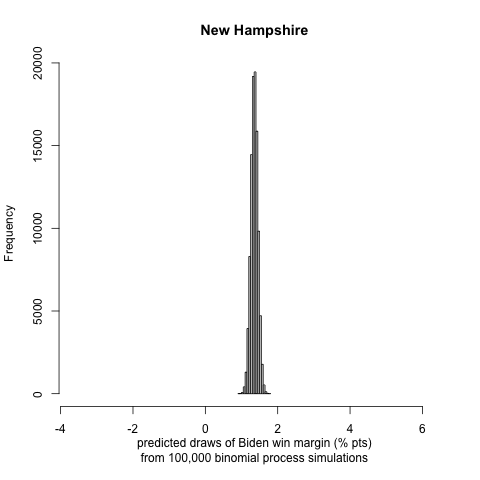
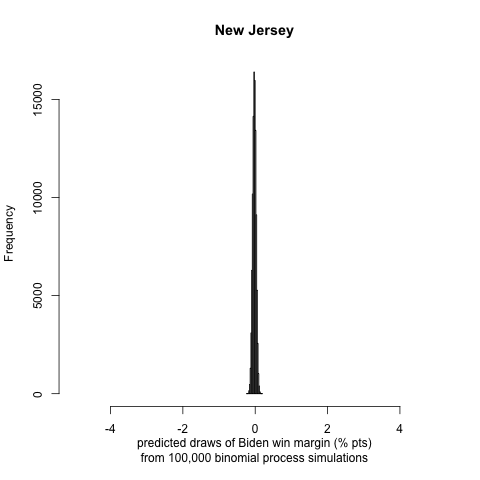
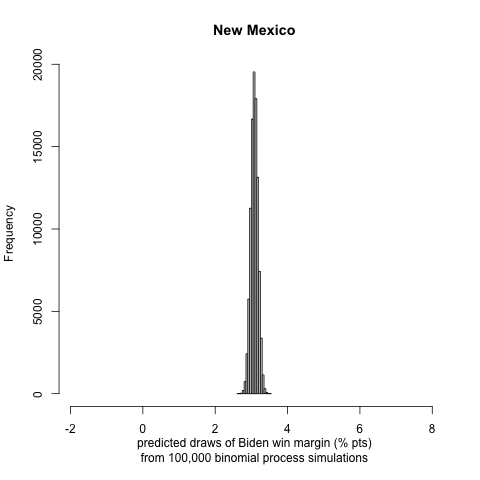
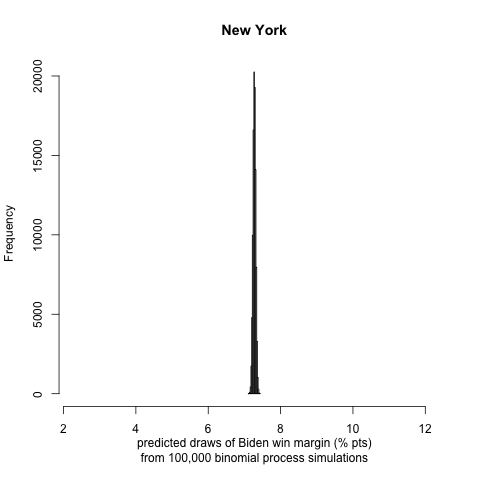
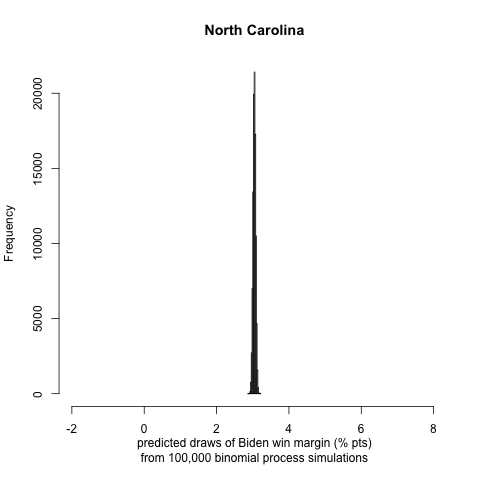
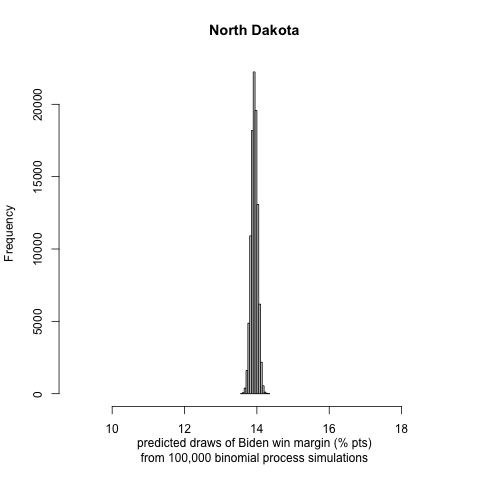
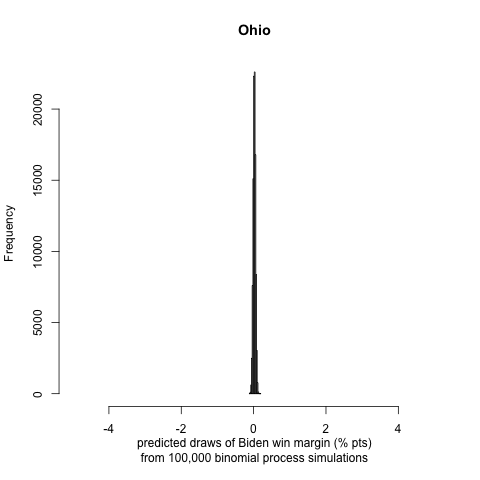
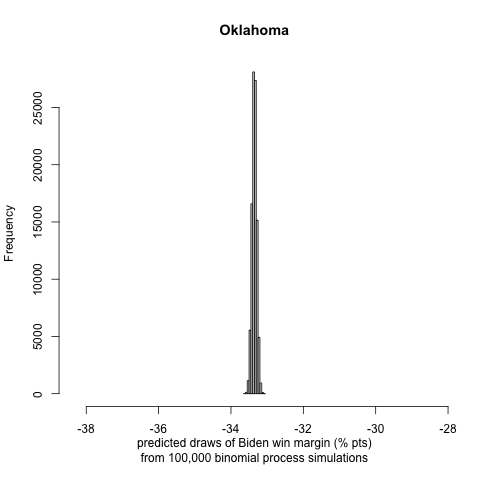
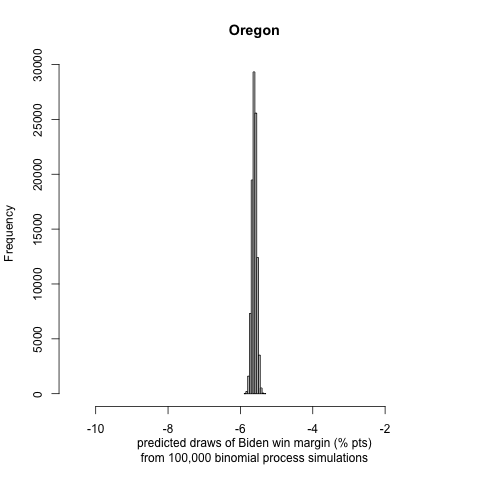
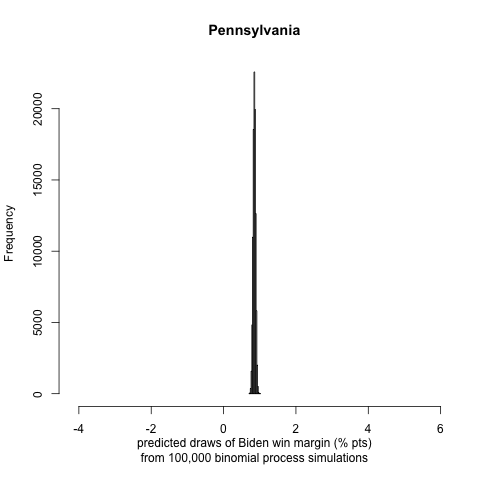
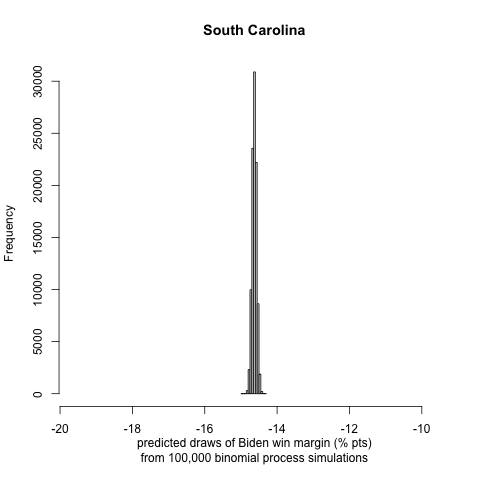
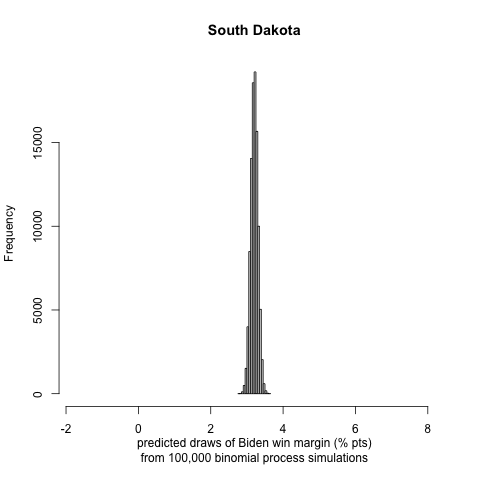
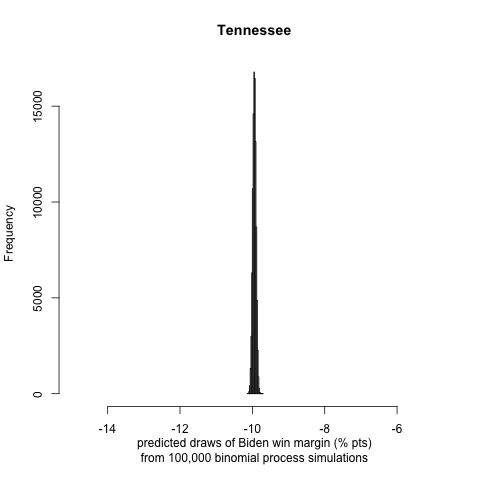
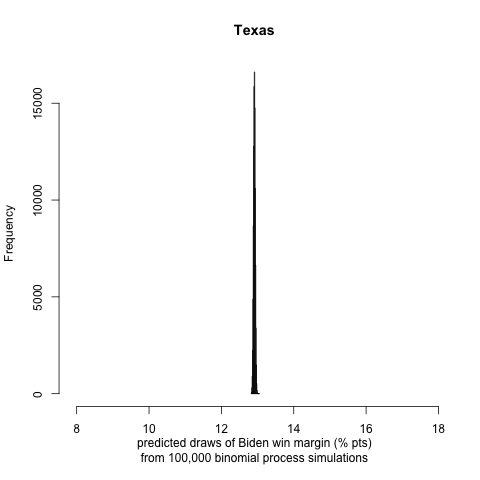
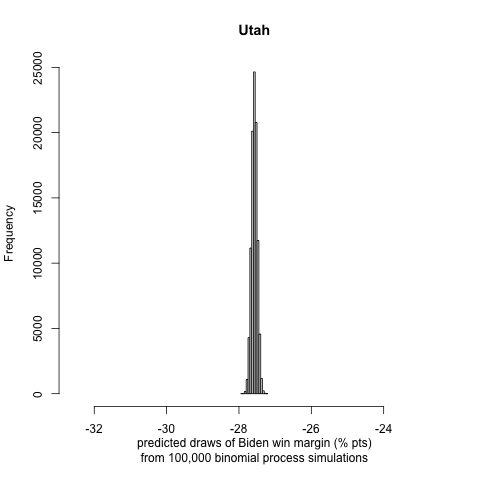
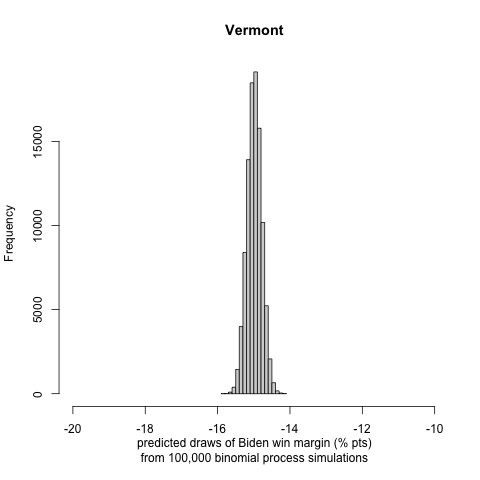
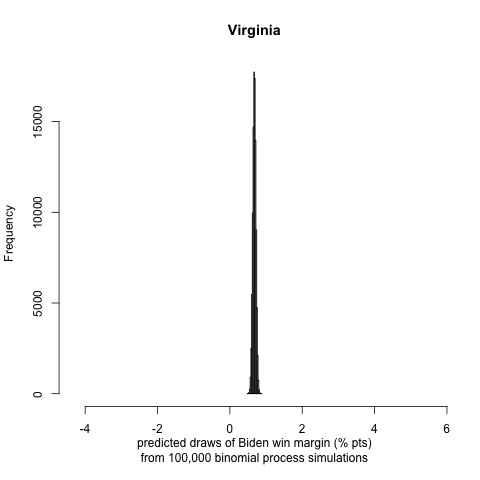
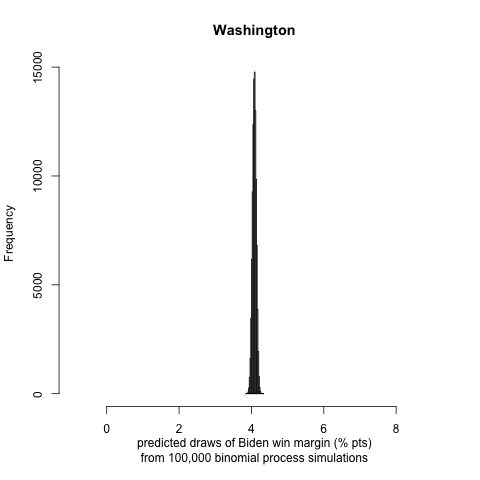
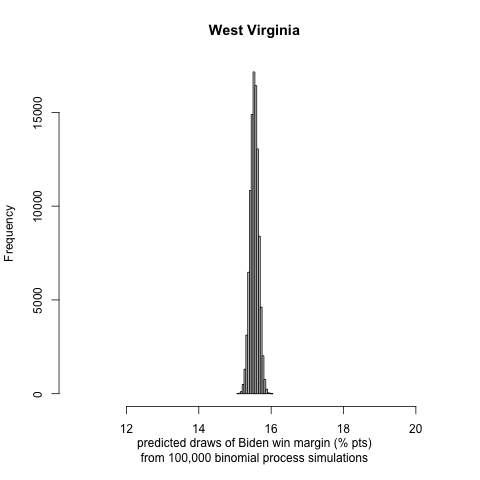
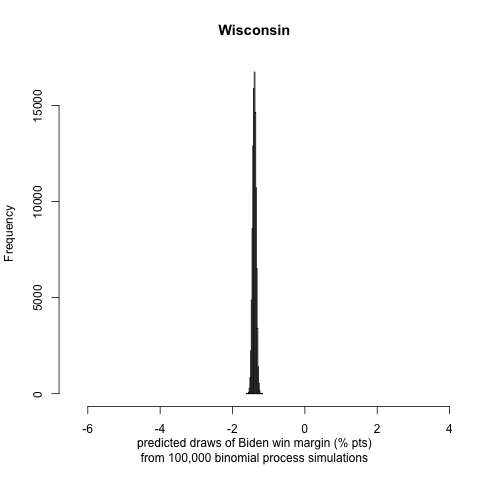
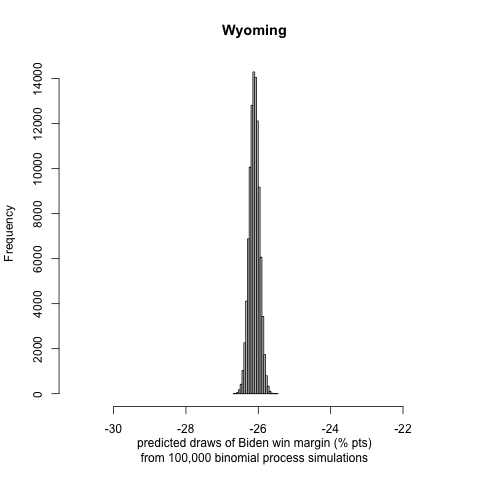
We simulate draws from 100,000 repeated Binomial process with a population of size VEP and a draw probability of predicted draw probabilities for Democrats and Republicans based on the binomial distribution model, derived from results of previous election cycles. Finally, we are simulating a distribution of election results, specifically calculating Biden’s win or loss (if negative) margin in each state, and then attributing the electoral votes of each state to the winner of that state. Note: absent specific polling results of each of the electoral districts in Maine and Nebraska, we assume that the general state vote will reflect on the distribution of those electoral votes, and follow the usual “winner takes all” electoral college vote distribution model.
We generate histograms of Biden’s win or loss (if negative) margin in each state:
 |
 |
 |
|---|---|---|
 |
 |
 |
 |
 |
 |
 |
 |
 |
 |
 |
 |
 |
 |
 |
 |
 |
 |
 |
 |
 |
 |
 |
 |
 |
 |
 |
 |
 |
 |
 |
 |
 |
 |
 |
 |
 |
 |
 |
 |
 |
 |
 |
 |
 |
 |
 |
 |
Model Evaluation
The probabilistic model successfully captures the great majority of strong or leaning Democratic and Republican states across the country. Our model presents some significant outliers, including the most striking result of Pres. Trump winning the state of California, while Mr. Biden wins the state of Texas and Florida, two key battleground states with considerable percentages.
Prediction Results
We calculated the following two-party electoral vote prediction: Biden: 322 electoral votes, Trump: 216 electoral votes. As we mentioned above, the prediction interval among individual states might not match that of reality, however, in the general sense, our probabilistic model predicts the electoral vote share result quite close to FiveFortyFive’s prediction (Biden: 346 electoral votes, Trump: 192 electoral votes).
Look under the hood
Feel free to test out our model using the R code and datasets, conveniently uploaded in a ZIP file.
Onwards
As we are looking forward to another week and coming closer to Election Day, we will evaluate the previously defined and fitted election prediction models while critically reviewing other researchers and political scientists’ models.