Week 7 - Considering Turnout Vol. II
Monday, October 26, 2020
“He says we’re learning to live with it. People are learning to die from it.” ~ Former Vice President Joe Biden
Introduction
This week, we go back to the different approach than the typical linear regression model fitting approach we followed in the last few weeks. This time, we update our turnout correction we created last week by incorporating COVID death rate changes in every state. Then, we calculate the turnout correction for the voter-eligible population (VEP) and then we employ Binomial logistic regression and think of the election outcome for Democrats as a finite draw of voters from the VEP turning out to vote Democrat, modeled as a binomial process.
Model Implementation
Let’s go back to our model expansion from last week:
This week, we expand our probabilistic model by incorporating the factor of turnout. Rather than fixing each state’s maximum number of Binomial draws to the state’s VEP, we draw a random number from a distribution constructed using VEP and our guess on the effect of COVID and vote-by-mail). To do so, we incorporate the following statistics:
- percentage of people that are older than 65 years old: more prone to COVID 19, but less accustomed to vote by mail. Therefore, they more likely to vote in person or be hesitant to turn out to vote.
- percentage of mail in votes in the last general state-wide election: shows us which states are usually gross mail-in states. In that case, we assume that people are more accustomed to the process.
- COVID-19 positivity rate: shows us how hard hit the state is by the pandemic. In that case, we assume that voters are more hesitant to show up at the polls for early or Election Day voting, but might prefer to vote by mail.
To further develop our model, we replace the COVID-19 positivity rate, with the weekly average of
Therefore, we update the following weighting model for VEP turnout:
turnout = turnout_2016 (1 – 0.2 * older_than_65 + 0.4 * mail_in_2016 – 0.3 * COVID_deaths). Note that the weights are created based on a “hierarchy” notion that COVID deaths will desensitize all voters more than the age concern for older people, while mail-in voting will provide an easy solution for the population portion that is hesitant to show up to the polls on Election Day, or vote early.
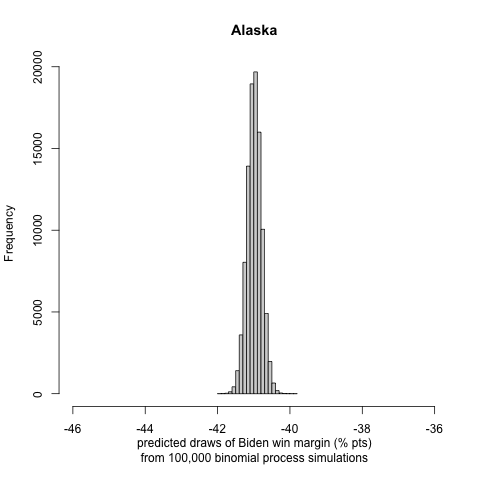
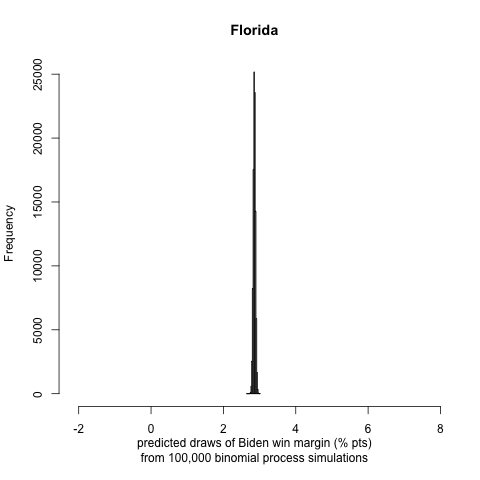
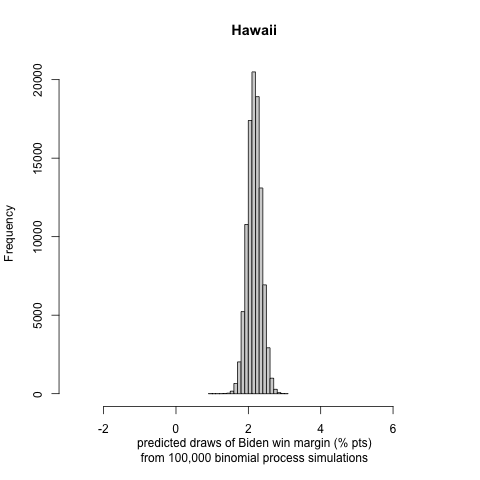
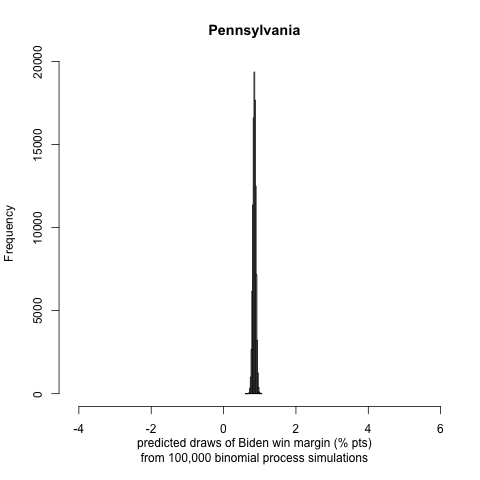
We generate histograms of Biden’s win or loss (if negative) margin in each state. We report the following interesting and note-worthy results:
 |
 |
|---|---|
 |
 |
Model Evaluation
The probabilistic model successfully captures the great majority of strong or leaning Democratic and Republican states across the country. Our model presents some significant outliers, including the most striking result of Pres. Trump winning the state of California once again, while Mr. Biden wins the state of Texas, Pennsylvania and Florida, three key battleground states with considerable percentages. Also, we observe very polarized results in Alaska and the District of Columbia. However, we are delighted to see some larger variance in the popular vote share win or lose margin in many states, meaning that our adjustments worked!
Prediction Results
We calculated the following two-party electoral vote prediction: Biden: 322 electoral votes, Trump: 216 electoral votes. As we mentioned above, the prediction interval among individual states might not match that of reality, however, in the general sense, our probabilistic model predicts the electoral vote share result quite close to FiveThirtyEight’s prediction (Biden: 346 electoral votes, Trump: 192 electoral votes).
Look under the hood
Feel free to test out our model using the R code and datasets, conveniently uploaded in a ZIP file.
Onwards
As we are finally coming closer to election day, we will evaluate the election prediction model while critically reviewing other researchers and political scientists’ models.