Week 6 - Considering Turnout
Monday, October 19, 2020
“If we truly believe in a vibrant democracy, then we must have the highest voter turnout in the world.” ~ Bernie Sanders, United States Senator from Vermont
Introduction
This week, we go back to the different approach than the typical linear regression model fitting approach we followed last week. This time, incorporate a turnout correction for the voter-eligible population (VEP) and then we employ Binomial logistic regression and think of the election outcome for Democrats as a finite draw of voters from the VEP turning out to vote Democrat, modeled as a binomial process.
How pollsters incorporate turnout fluctuations
Before we begin our own turnout simulation adventure, we take a look at how two leading pollsters and election result predictors. In particular we investigate the methods of FiveThirtyEight and the Economist in adjusting their error rates to reflect the uncertainty in voter turnout based on the coronavirus pandemic.
In FiveThirtyEight’s case, they are facing conflicting underlying conditions, making it harder to predict turnout in the general election. On the one hand, traditional ways of voting, like in-person voting on Election Day, are viewed as less safe in the COVID-19 pandemic era. However, this new reality presents the opportunity to implement alternative and possibly more convenient voting methods, like mail-in voting.
Moreover, they expect it to be more difficult to predict election results in the presidential election, as a steep increase or decrease in voter turnout. Therefore, 538 increased the “national Election Day error, correlated state error and state-specific error by 20 percent relative to their usual values” to represent that uncertainty (they calculate that a 50% voter turnout result error translates into a 20% popular vote share result error).
However, an analysis performed by the same organization shows that things might not be that different after all. In general, people in recent months have been voting by mail in smaller percentages compared to the spring, showing that we will not be having a predominantly mail election. Also, the pandemic did not lower turnout rates across statewide elections these past few months, but rather increased voter participation. Lastly, the pandemic seems to have shifted the way people vote (from massively in-person on Election Day to mail-in voting and early voting), thus reducing the overload of election systems and lowering the amount of election issues reported.
The Economist follows a comparative approach: they compare results of the voting-eligible population and the likely-to-vote population. The Economist model, then, estimates the impact of each of the turnout factor on survey outcomes, and adjusts for them.
Model Implementation
Let’s go back to our model description from last week:
To improve our probabilistic model, and account for any model outliers, instead of a calculating the probability for a single Democratic voter showing up to the polls and voting for the Democratic presidential nominee, or the single expected number of Democratic voters from the population, we predict a distribution of Democratic voter draws from the respective binomial process on that population.
We simulate draws from 100,000 repeated Binomial process with a population of size VEP and a draw probability of predicted draw probabilities for Democrats and Republicans based on the binomial distribution model, derived from results of previous election cycles. Finally, we are simulating a distribution of election results, specifically calculating Biden’s win or loss (if negative) margin in each state, and then attributing the electoral votes of each state to the winner of that state. Note: absent specific polling results of each of the electoral districts in Maine and Nebraska, we assume that the general state vote will reflect on the distribution of those electoral votes and follow the usual “winner takes all” electoral college vote distribution model.
This week, we expand our probabilistic model by incorporating the factor of turnout. Rather than fixing each state’s maximum number of Binomial draws to the state’s VEP, we draw a random number from a distribution constructed using VEP and our guess on the effect of COVID and vote-by-mail). To do so, we incorporate the following statistics:
- percentage of people that are older than 65 years old: more prone to COVID 19, but less accustomed to vote by mail. Therefore, they more likely to vote in person or be hesitant to turn out to vote.
- percentage of mail in votes in the last general state-wide election: shows us which states are usually gross mail-in states. In that case, we assume that people are more accustomed to the process.
- COVID-19 positivity rate: shows us how hard hit the state is by the pandemic. In that case, we assume that voters are more hesitant to show up at the polls for early or Election Day voting, but might prefer to vote by mail.
Therefore, we create the following weighting model for VEP turnout:
turnout = turnout_2016 (1 – 0.2 * older_than_65 + 0.3 * mail_in_2016 – 0.1 * COVID_positivity). Note that the weights are suggestive of the impact we are expecting for each variable.
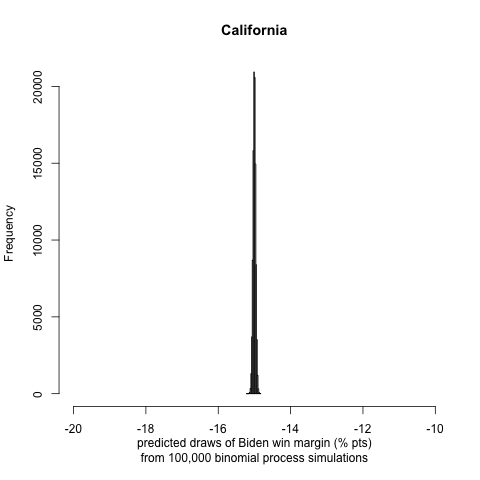
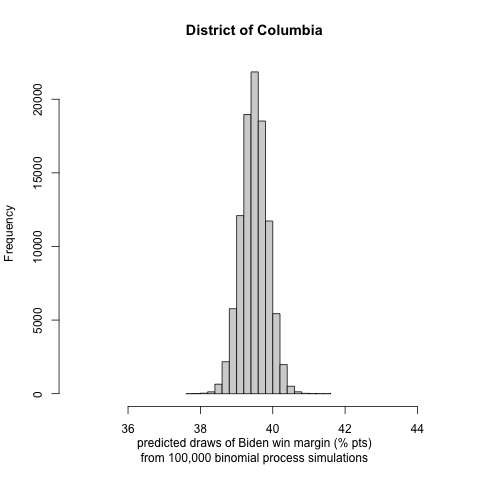
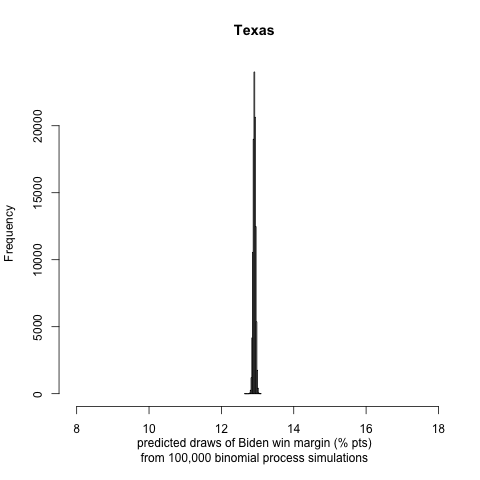
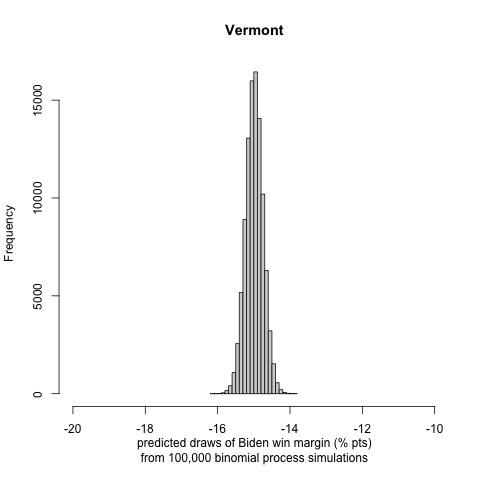
We generate histograms of Biden’s win or loss (if negative) margin in each state. We report the following interesting and note-worthy results:
 |
 |
|---|---|
 |
 |
 |
Model Evaluation
The probabilistic model successfully captures the great majority of strong or leaning Democratic and Republican states across the country. Our model presents some significant outliers, including the most striking result of Pres. Trump winning the state of California once again, while Mr. Biden wins the state of Texas and Florida, two key battleground states with considerable percentages. Also, as shown in the graphs above, we observe very polarized results in Alaska and the District of Columbia. However, we are delighted to see some larger variance in the popular vote share win or lose margin in many states, as shown in the D.C. and Vermont graphs. Our adjustments worked!
Prediction Results
We calculated the following two-party electoral vote prediction: Biden: 322 electoral votes, Trump: 216 electoral votes. Interestingly, two-party electoral vote prediction remained the same after our turnout correction. As we mentioned above, the prediction interval among individual states might not match that of reality, however, in the general sense, our probabilistic model predicts the electoral vote share result quite close to FiveThirtyEight’s prediction (Biden: 346 electoral votes, Trump: 192 electoral votes).
Look under the hood
Feel free to test out our model using the R code and datasets, conveniently uploaded in a ZIP file.
Onwards
As we are looking forward to another week and coming closer to election day, we will evaluate the previously defined and fitted election prediction models while critically reviewing other researchers and political scientists’ models.