Week 3 - Grading Election Polls
Monday, September 28, 2020
“I always lose the election in the polls, and I always win it on election day.” ― Benjamin Netanyahu, Prime Minister of Israel
Introduction
This week, we make a new prediction model by comparing FiveThirtyEight’s election poll rankings. In particular, we will make a national popular vote prediction model based on the scaled results of each poll, influenced by FiveThirtyEight’s election poll rankings.
Election Poll Rankings
Selecting the right quarter
We wanted to examine the variation in pollster quality, as reported by the grading given by FiveThirtyEight. According to FiveThirtyEight’s website:
FiveThirtyEight’s pollster ratings are calculated by analyzing the historical accuracy of each firm’s polls along with its methodology. Accuracy scores are adjusted for the type of election polled, the poll’s sample size, the performance of other polls surveying the same race, and other factors. We also calculate measures of statistical bias in the polls.
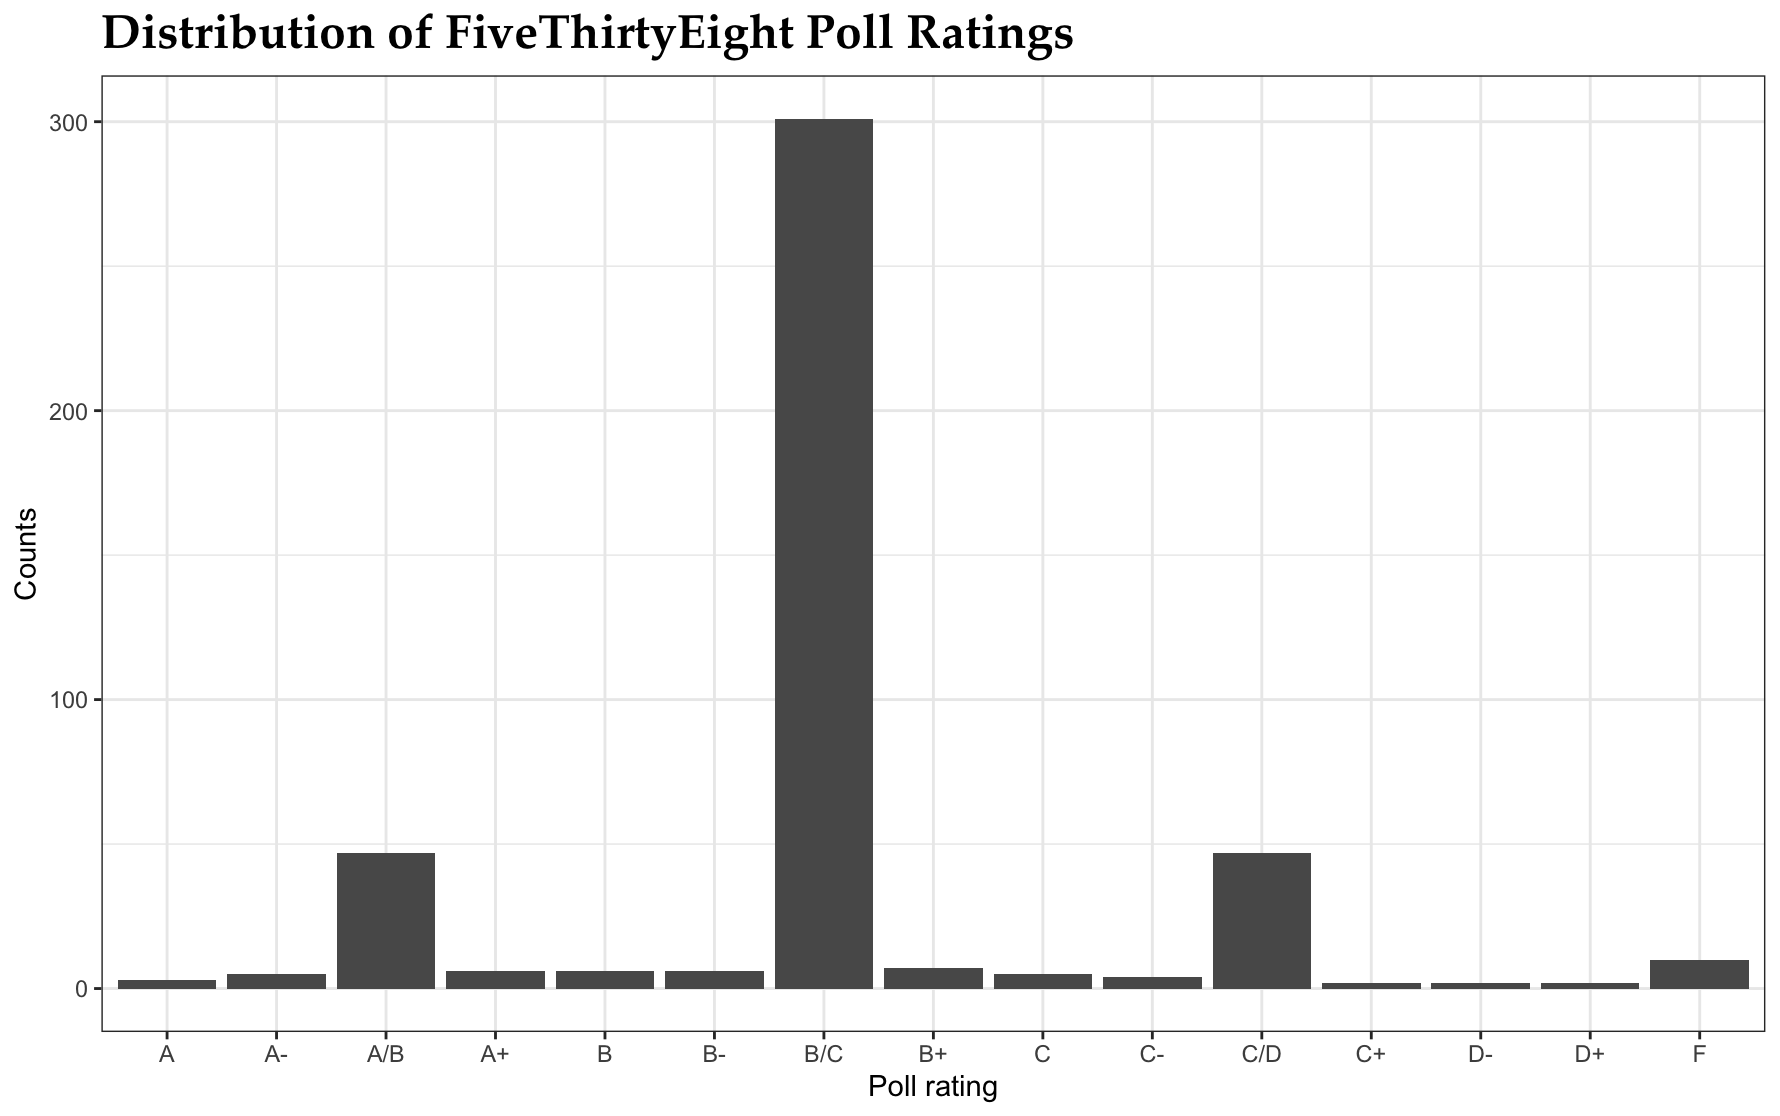
In our analysis, we examine the distribution of letter poll ratings that FiveThirtyEight provides based on each poll’s Predictive Plus-Minus rating, which aims to address the variation between methodological standards score and accuracy differences between each poll and includes a “herding penalty” for pollsters with low methodology ratings. In the histogram we generated, we observe that the large majority of pollsters receive a fair Predictive Plus-Minus rating. Intrigued by the results, we decided to incorporate the ratings into our predictive model.
Building a model based on poll ratings
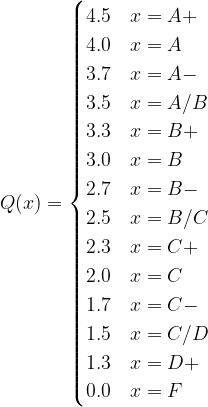
For each of the poll ratings, we use the following scoring function, where x represents each one of the poll results:
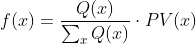
To normalize all election poll results and calculate the “contibution” of each result to the final calculated popular vote share of a candidate, we devide each score over the sum of all poll scores, and then multiply it with the actual national vote:
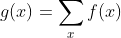
Finally, the popular vote share calculated for a specific candidate is:
Prediction Results
Using the data provided from the 2020 election polls, and our model formula for scaling the popular vote share of each poll result to match the rating provided by FiveThirtyEight, we filtered for national polls, and scaled the contributions of each poll based on the scores of all polls in the sample. We calculated the following popular vote prediction:
Biden: 49.17621%, Trump: 41.94046%
Look under the hood
Feel free to test out our model using the R code and datasets, conveniently uploaded in a ZIP file.
Onwards
As we are looking forward to another week and coming closer to Election Day, we will start revising and updating our own election prediction models while critically reviewing other researchers and political scientists’ models.