Week 2 - Pennies and Quarters
Monday, September 22, 2020
“To preserve our independence we must not let our rulers load us with perpetual debt. We must make our election between economy and liberty or profusion and servitude.” ― Thomas Jefferson
Introduction
This week, we start creating our election prediction model by comparing economy data with popular vote results. In particular, we will make and compare a national popular vote prediction model based on the second or third-quarter GDP growth percentage of election years.
Quarter Economics: Predicting the election result based on GDP growth
Selecting the right quarter
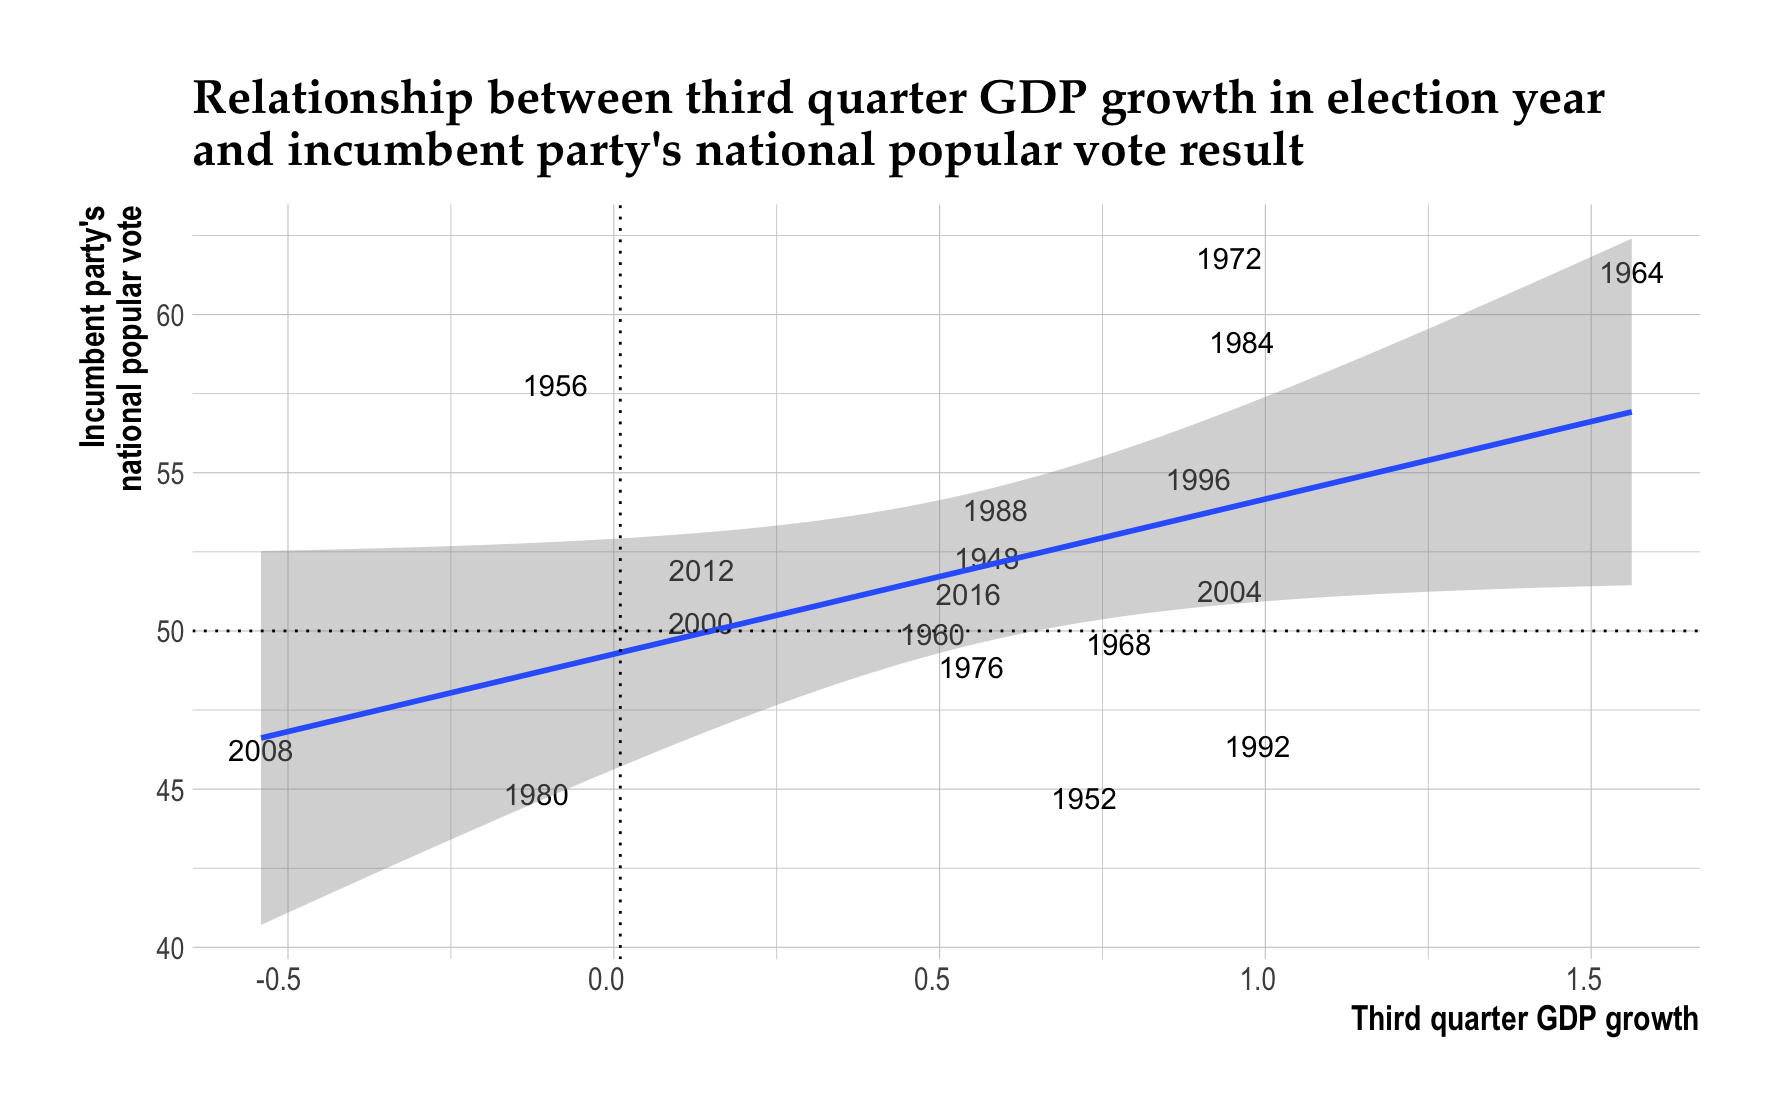
We begin by looking at the differences between election prediction models that use the percent growth of the Gross Domestic Product in the second or third quarters to predict the popular vote result. To do so, we use linear regression to create a predictive model based on the second quarter (Q2) and third quarter (Q3) GDP quarterly growth percentages. In our updated GDP quarterly growth CSV file, we used estimates from Morgan Stanley, IHS Markit, S&P Global Ratings, and the Federal Reserve Bank of Atlanta to calculate the average estimated Q3 GDP growth in 2020 as 20.35%.
Working with the data on the updated GDP quarterly growth and the popular election vote results, we generate the following plots:
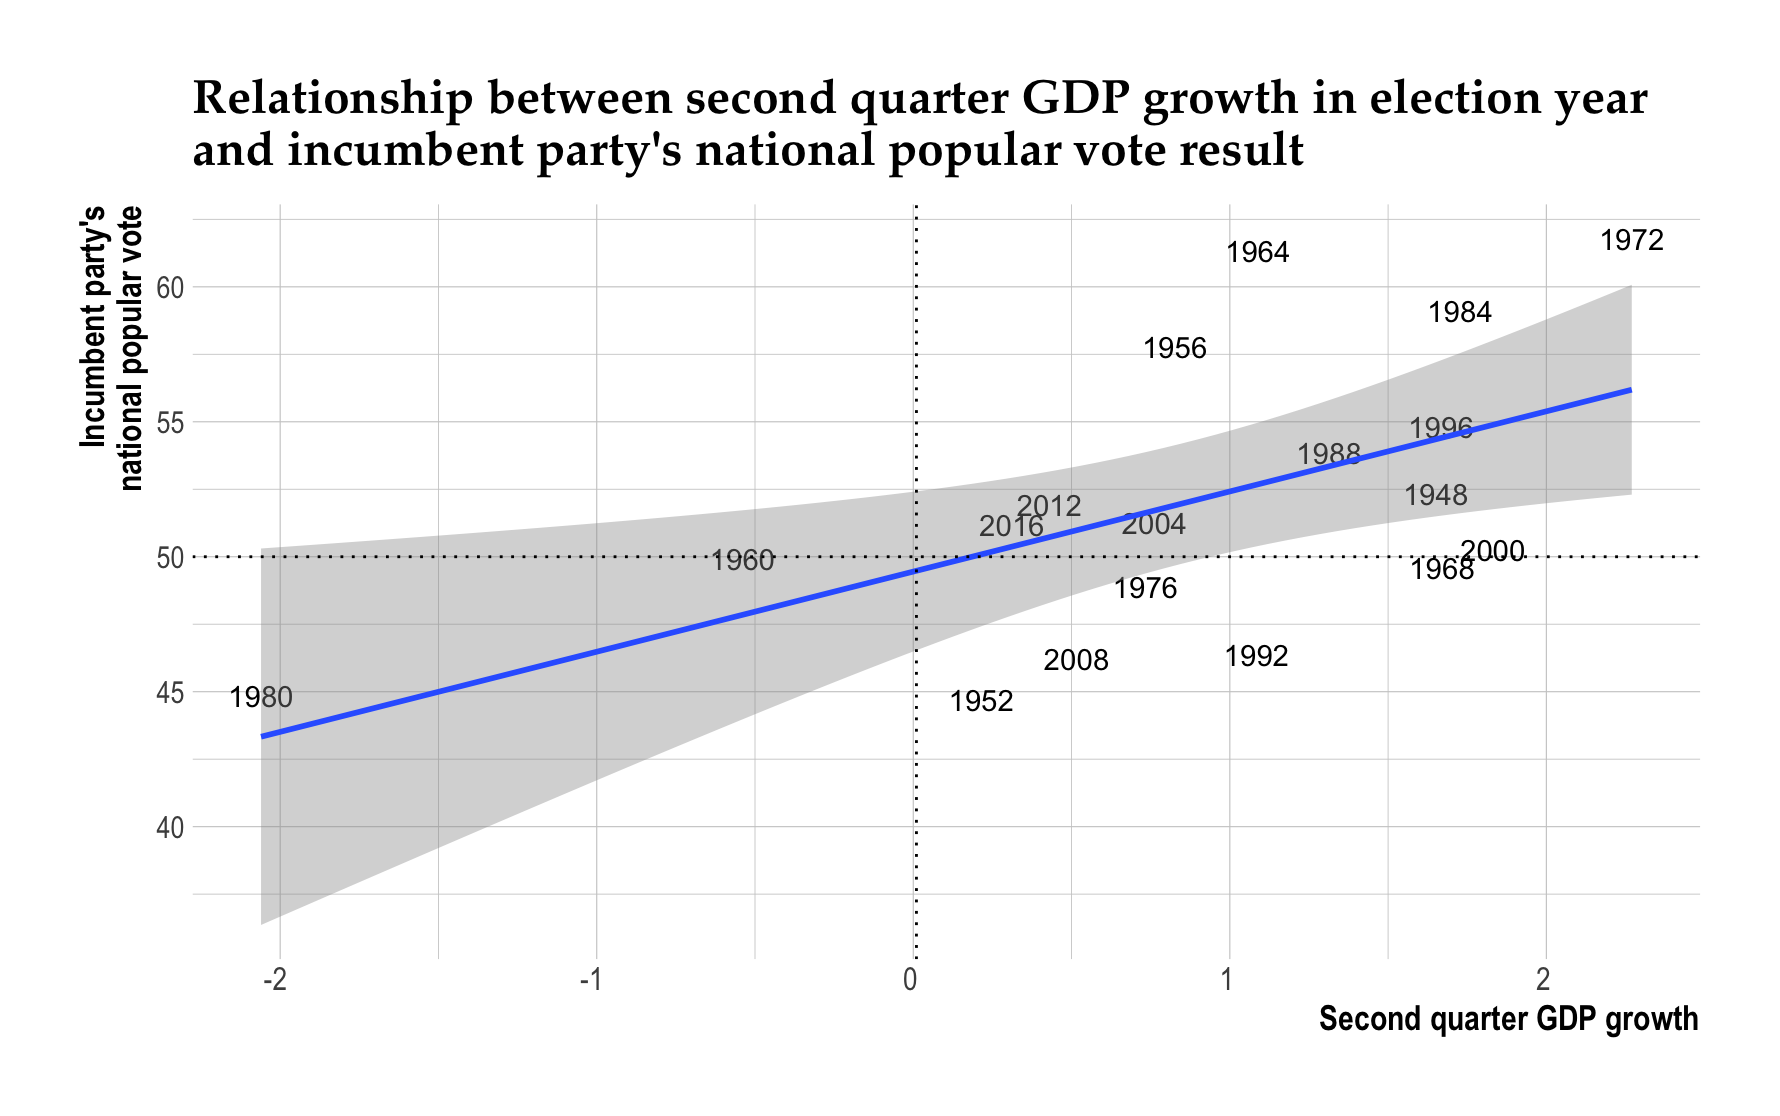
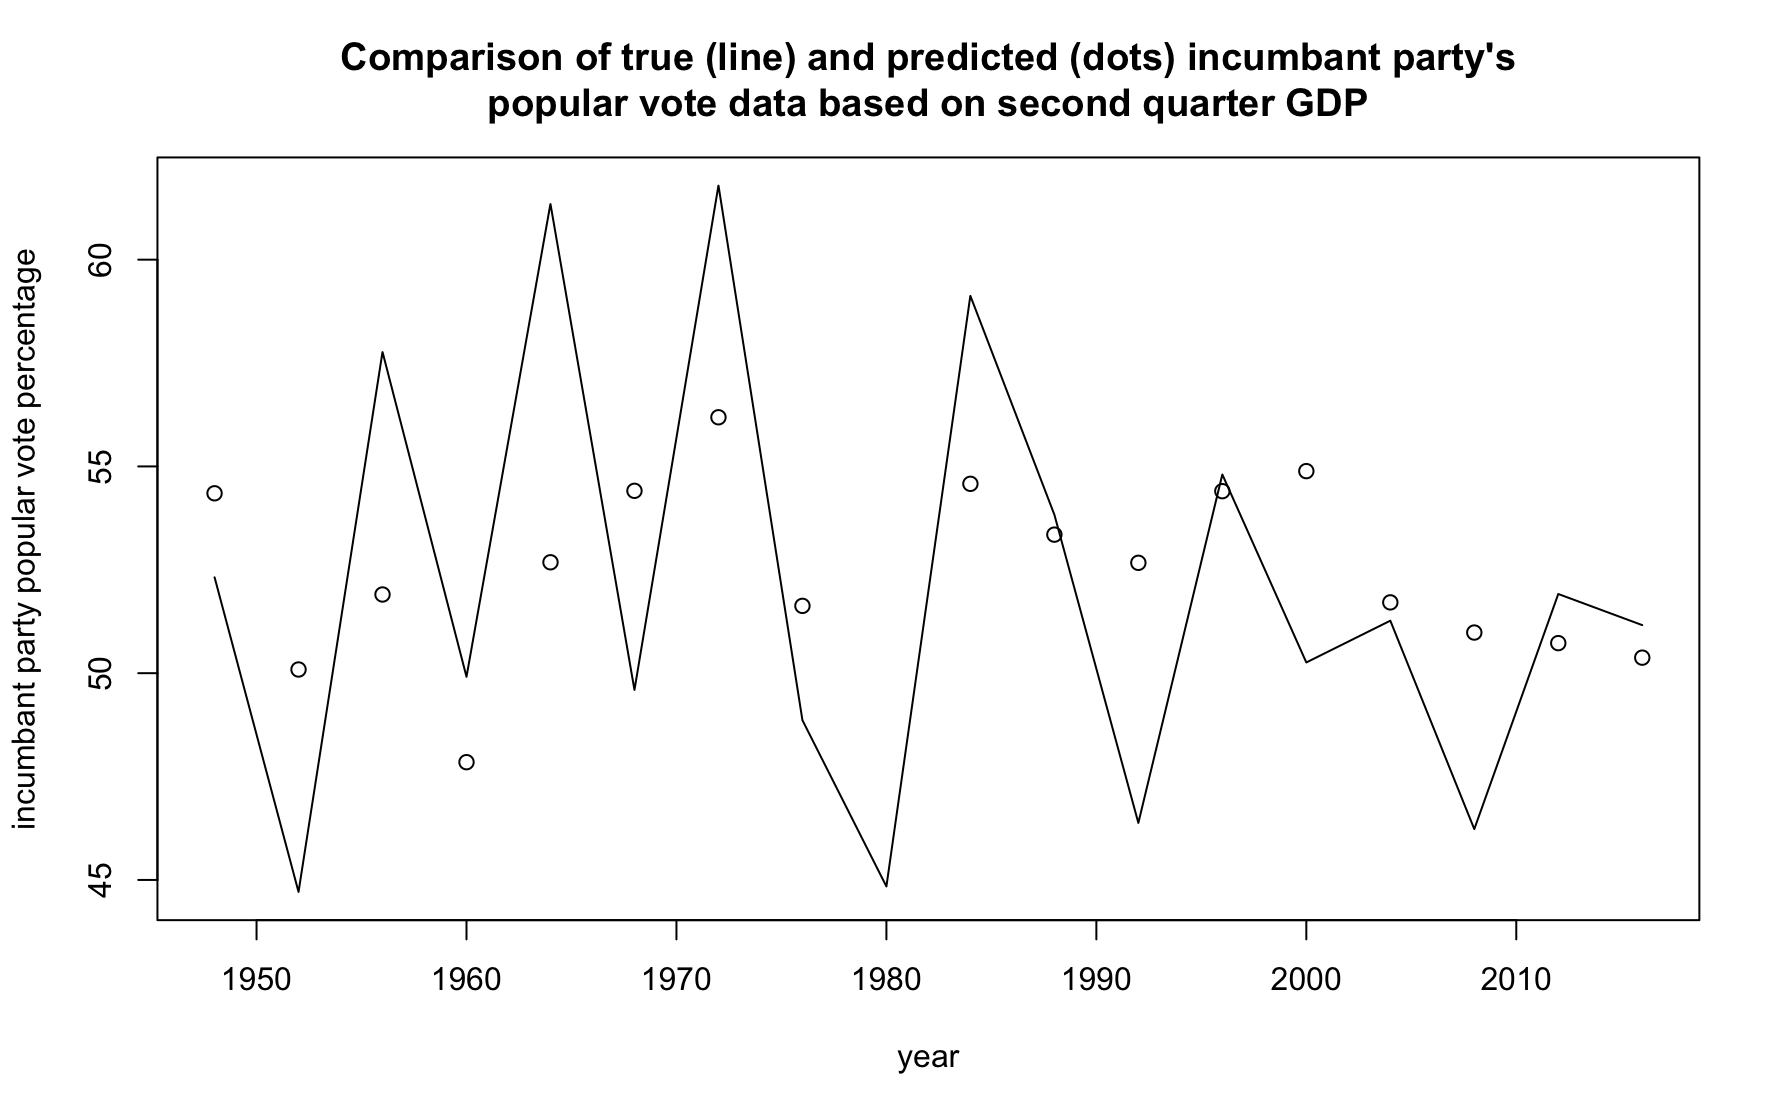
To understand which model predicts the actual election results better, we then compare the two model fits by plotting the in-sample error via residuals, which captures the difference between each observed and predicted value.
| Second Quarter | Third Quarter |
|---|---|
 |
 |
We observe that the predicted data points fit better with the line of the actual data on our third-quarter GDP growth prediction model. We decide to take a more detailed look by plotting a histogram of the frequency of the magnitudes of the residuals.
| Second Quarter | Third Quarter |
|---|---|
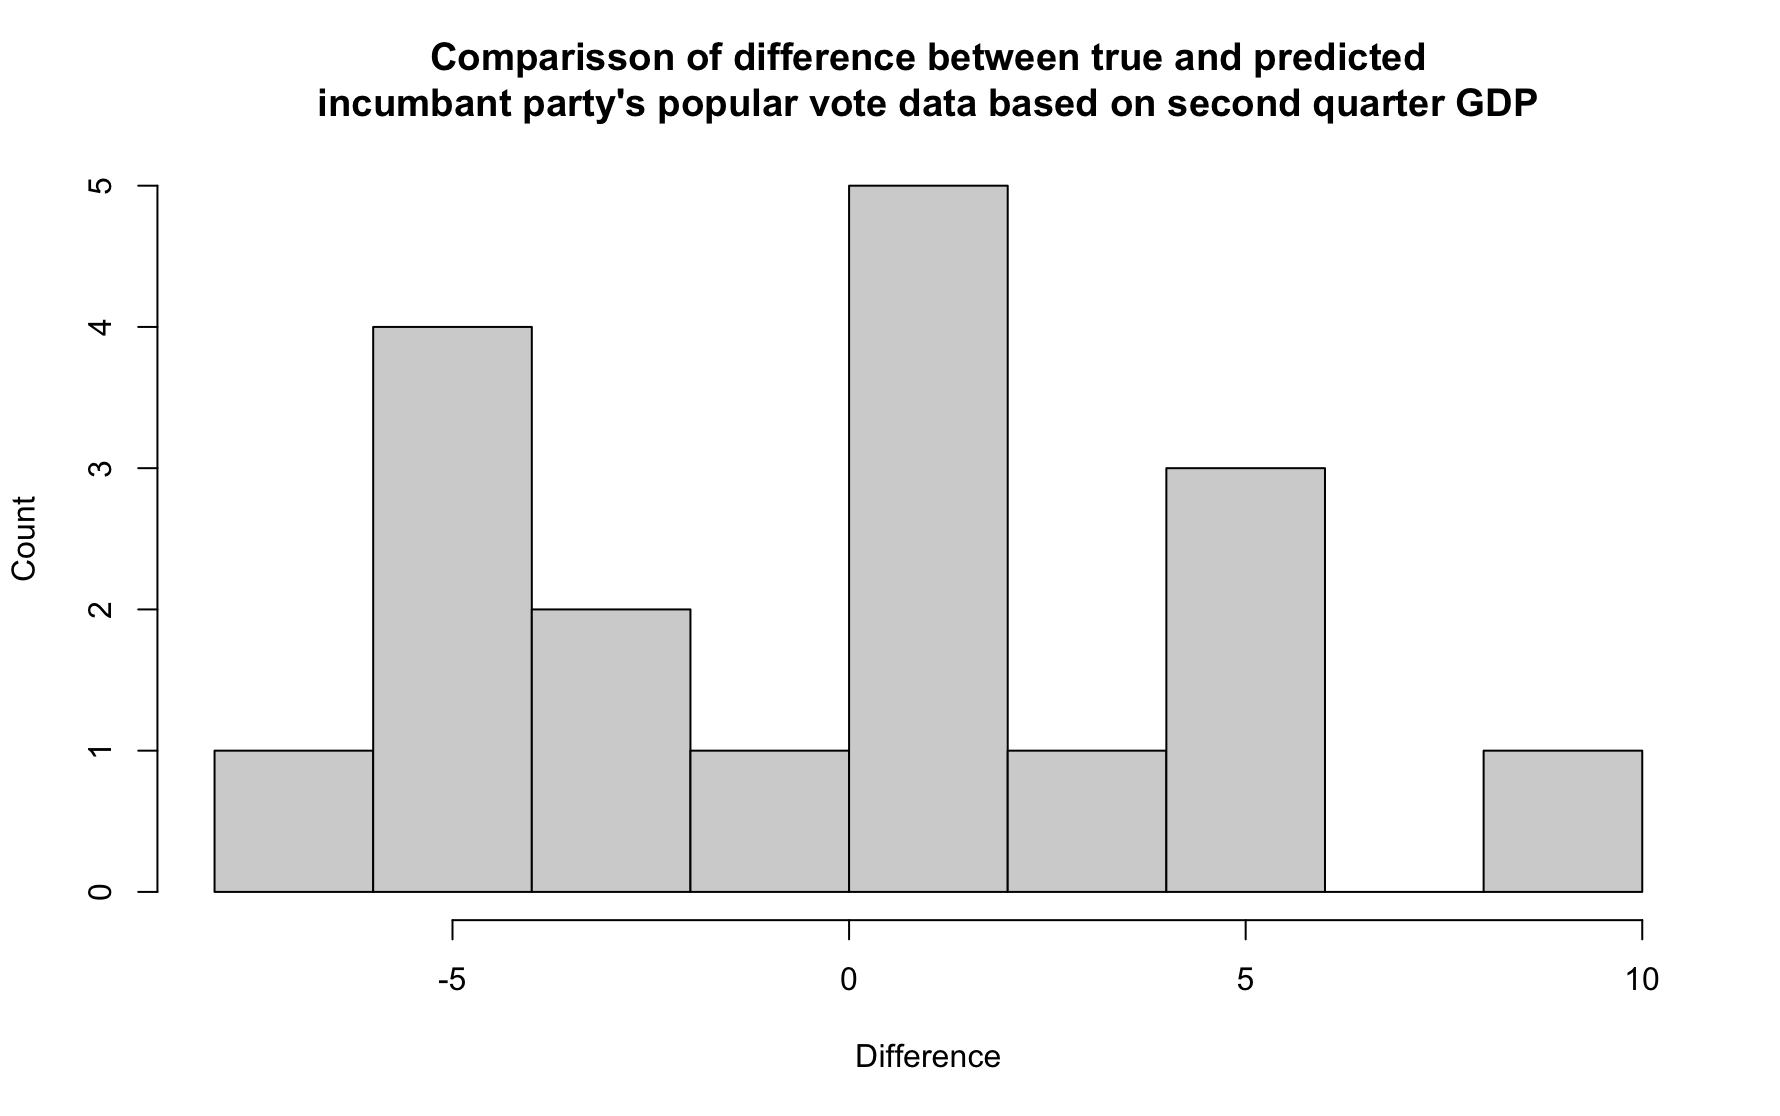 |
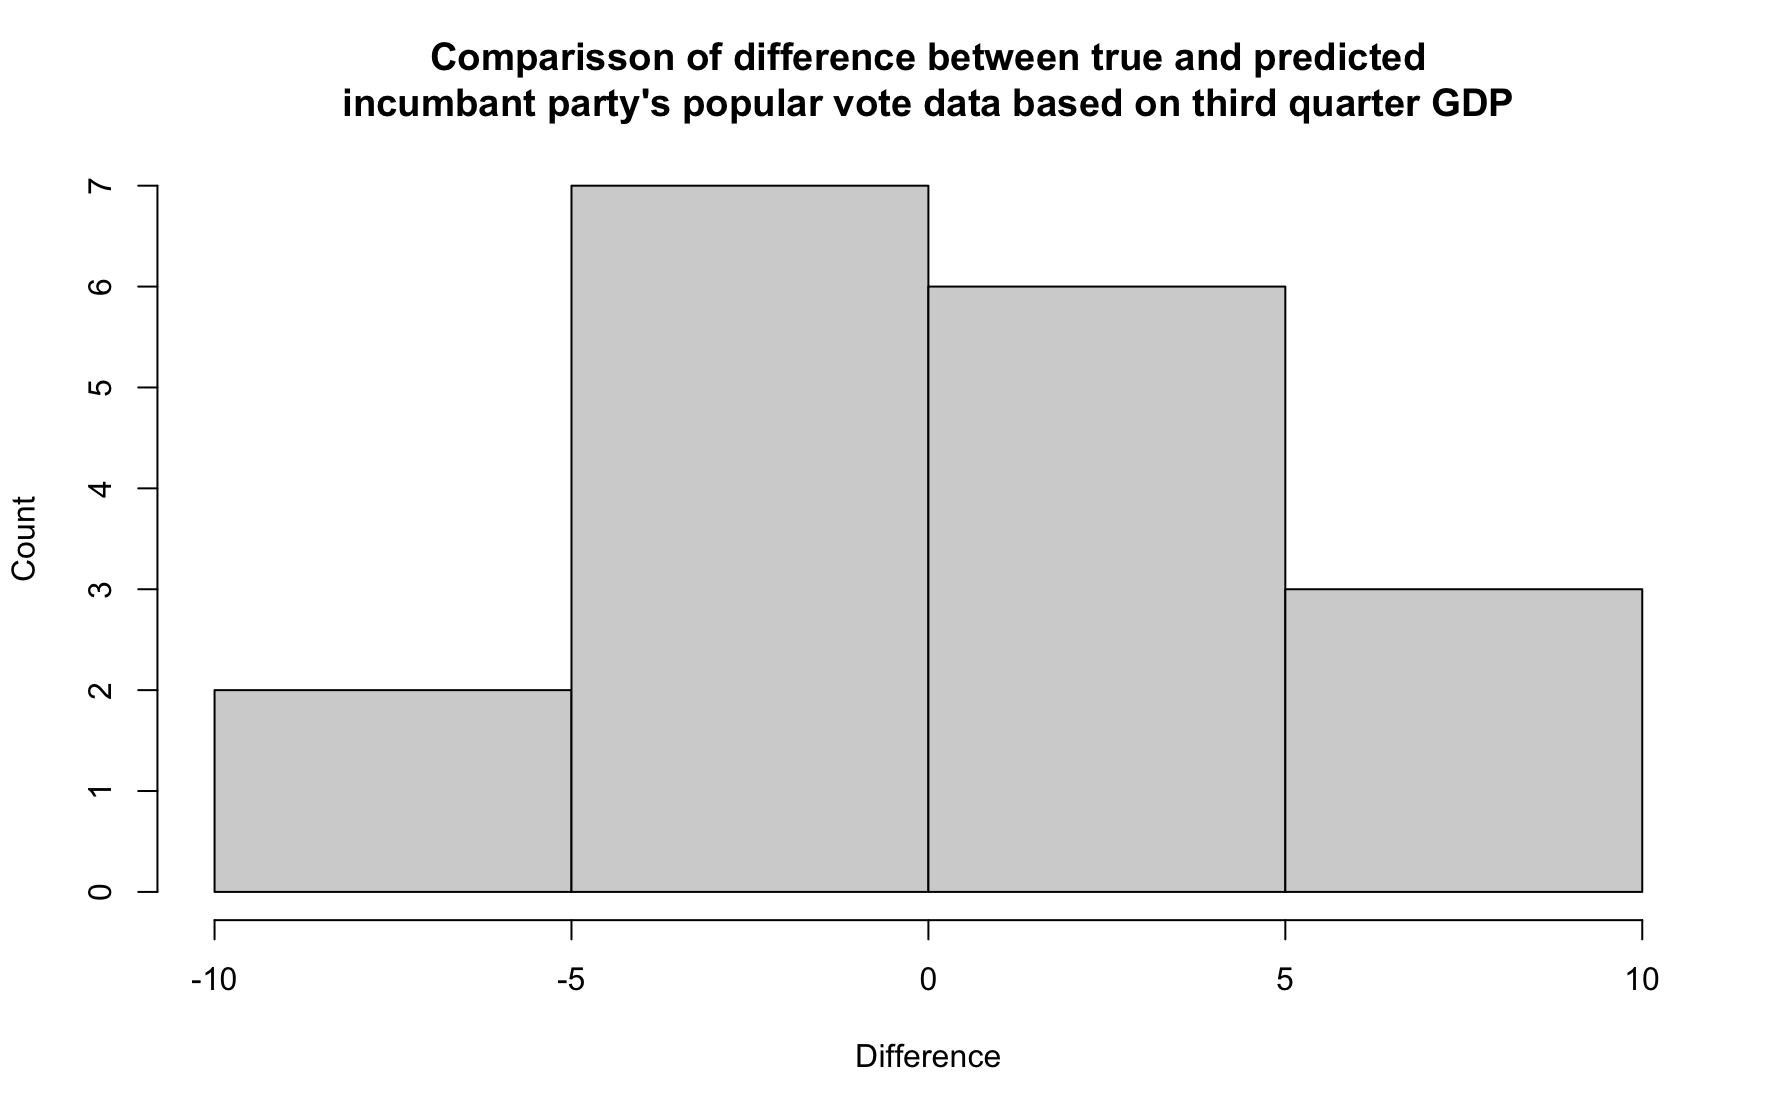 |
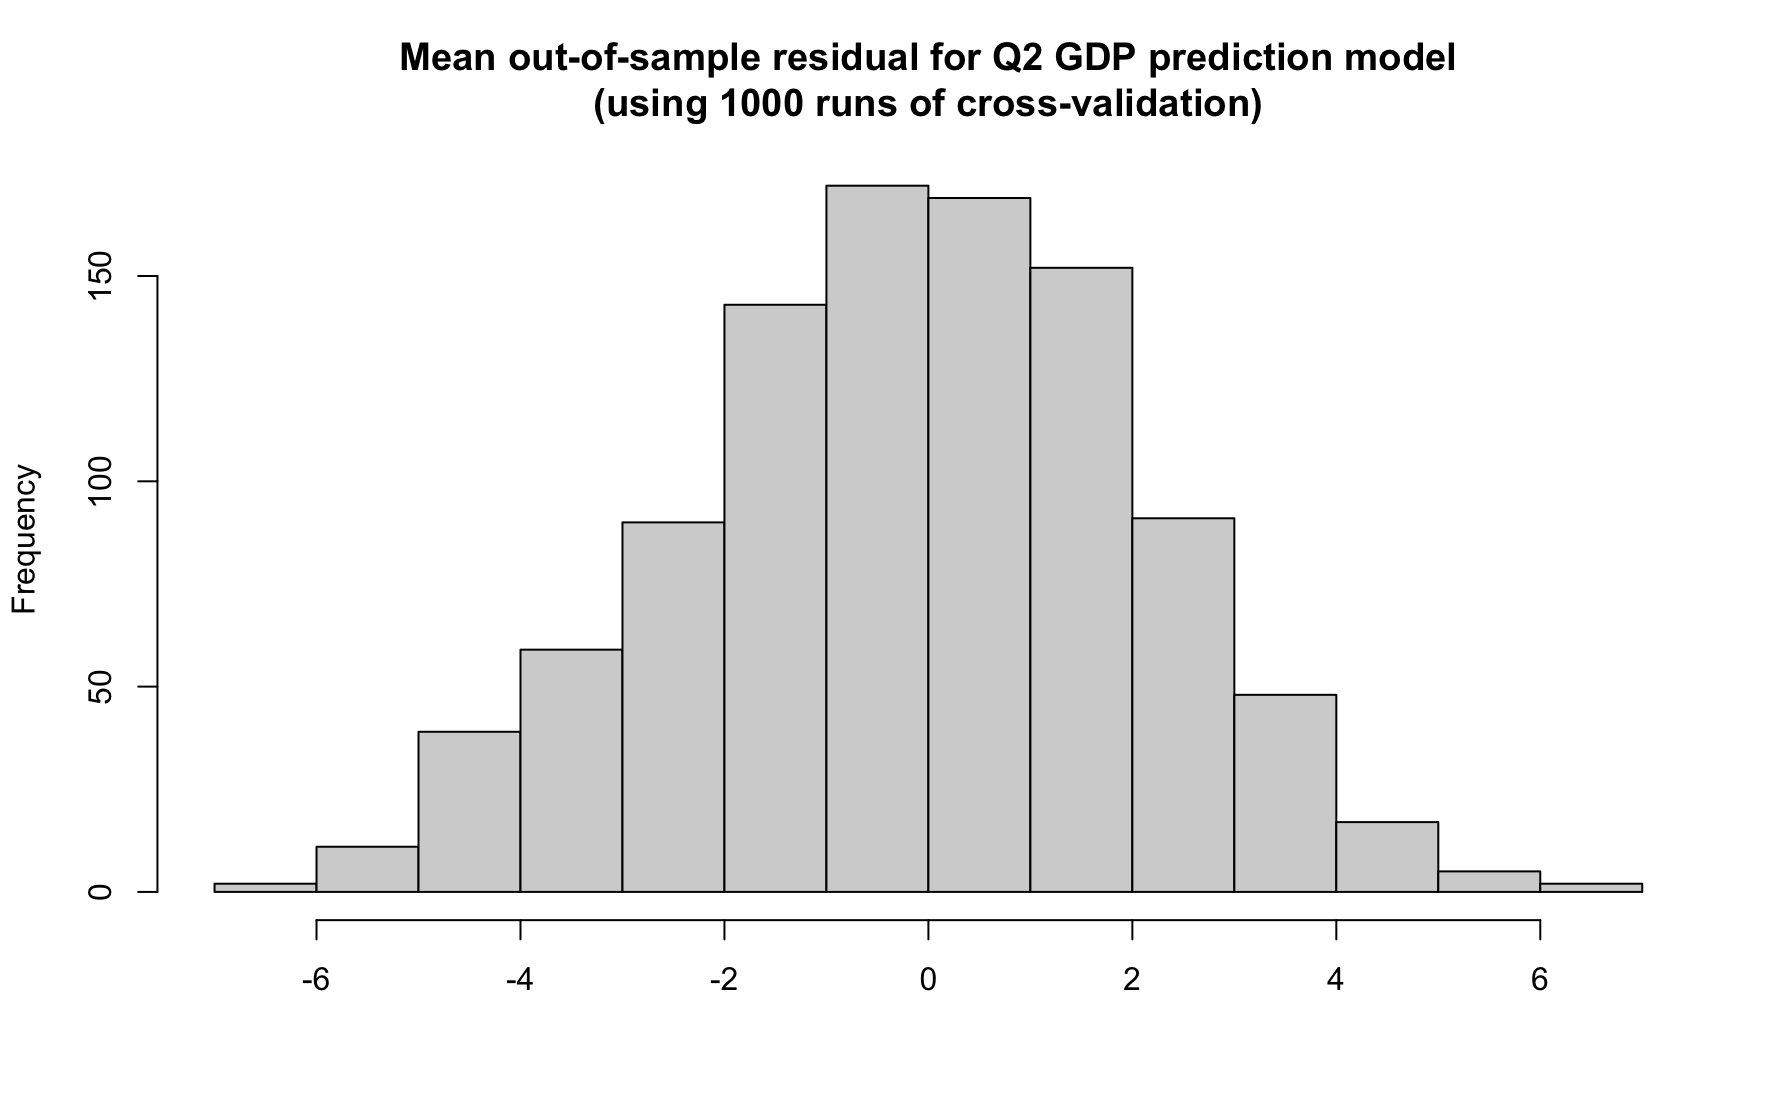
Once again, we observe a wider spread of the residual magnitudes on our Q2 GDP growth prediction model, which means that the Q2 GDP growth prediction model that we devised fits the true data in a better way, pointing us to select that model instead. We perform one final model test, cross-validation. In this test, we withhold a random subset of the sample, fit the predictive model on the rest of the sample, and evaluate its predictive performance on the held-out observations. We chose this model testing method against one out-of-sample testing (withholding one observation before fitting and see how well the model predicts the true value for the held-out observation), as it involves repeatedly evaluating performance against many randomly held-out “out-of-sample” datasets. This approach provides for a more accurate and reliable model testing method. In our examples, we run 1000 single cross-validation tests and report the mean out-of-sample residual in each case. Finally, we plot the following histograms that present the spread of mean residuals for each of the cross-validation of the two predictive models.
| Second Quarter | Third Quarter |
|---|---|
 |
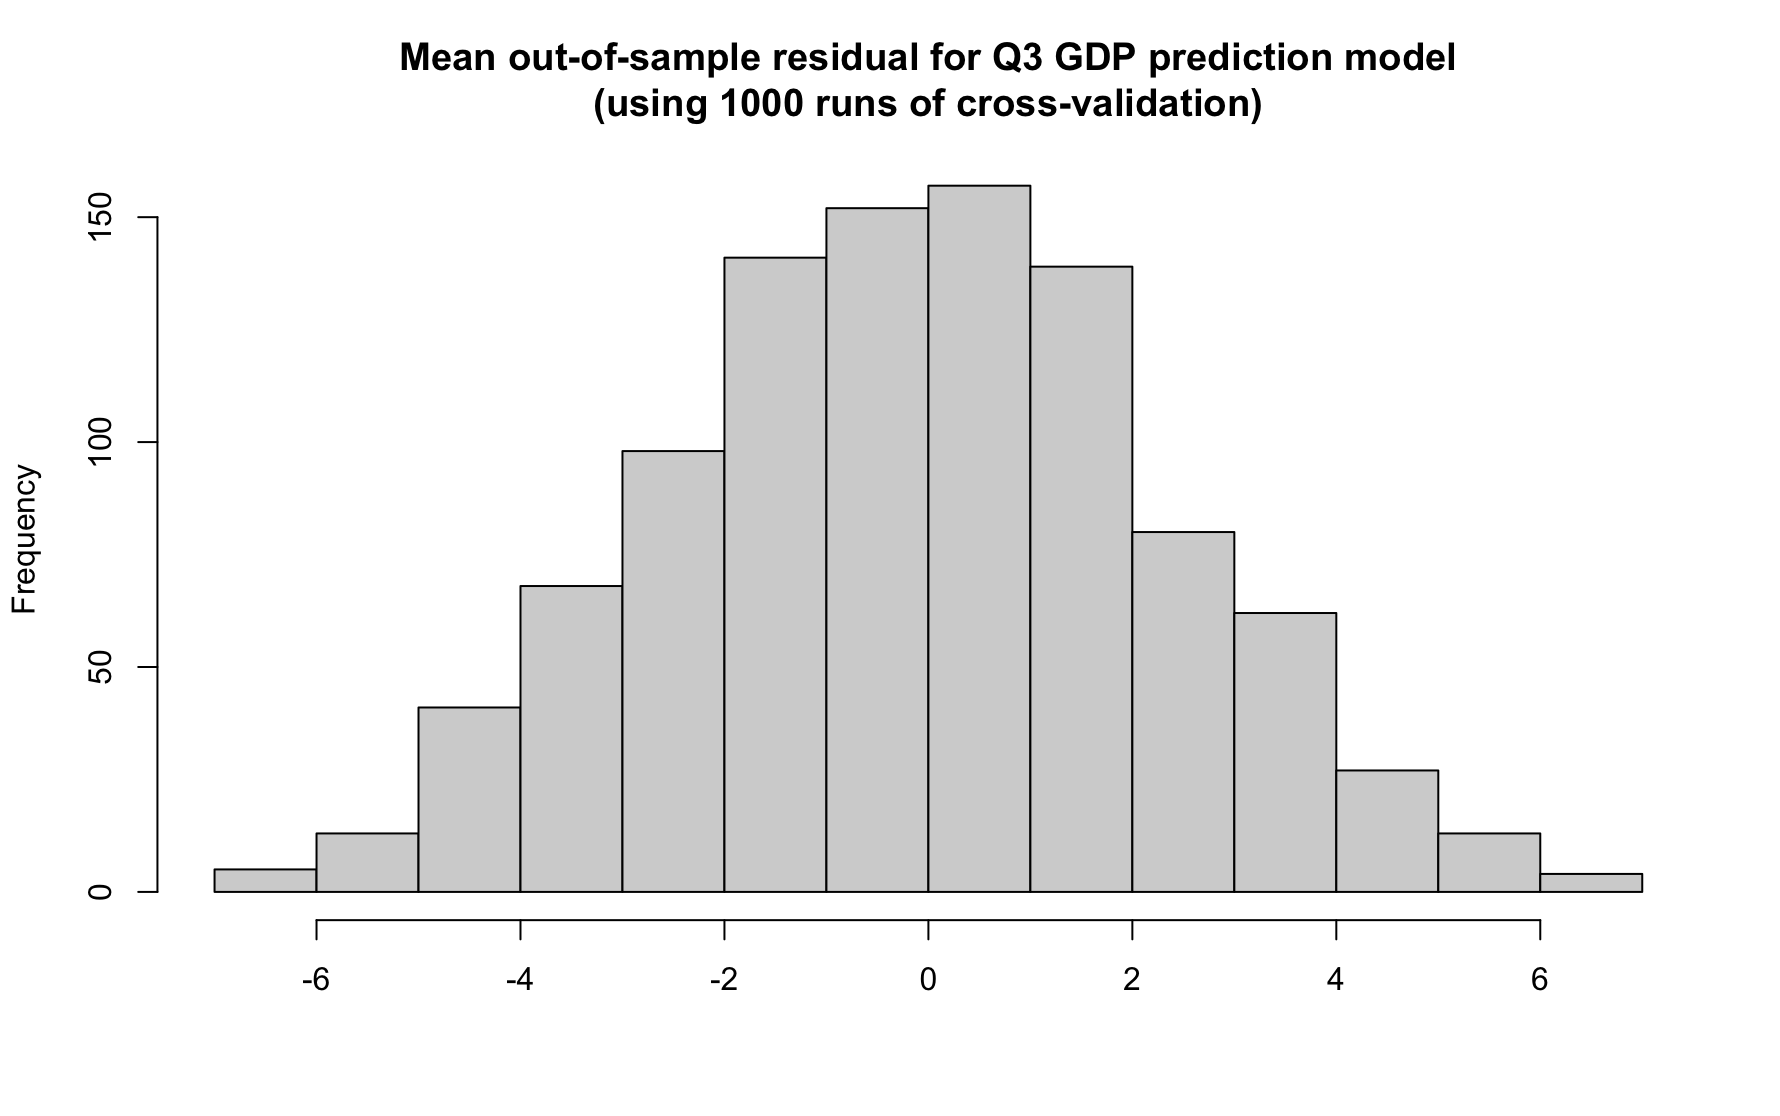 |
The spread of the mean residuals confirms what we were expecting: the third quarter GDP quarterly growth prediction model is a better predictor for the incumbent party’s popular vote election results, compared to the second quarter GDP quarterly growth prediction model.
The actual prediction
Using the third quarter GDP quarterly growth prediction model for the incumbent party’s popular vote election results, we get the following linear predictive model: Y(X) = 4.9X + 49.269, where Y(X) represents the incumbent party’s popular vote election result prediction, and X represents the third quarter GDP quarterly growth percentage in the year of the election. Using that model, we predict that the Republican’s national popular vote election result will be 43.08184% this November, predicting a win of the Democrats, securing 56.91816% of the total national popular vote (assuming a two-party popular vote share). This prediction seems much more plausible than the 21.25928% Republican national popular vote election result that the second-quarter GDP quarterly growth model prediction.
Look under the hood
Feel free to test out our model using the R code and datasets, conveniently uploaded in a ZIP file.
Onwards
As we are looking forward to another week and coming closer to election day, we will start revising and updating our own election prediction models while critically reviewing other researchers and political scientists’ models.