Final Election Prediction Reflection - Looking Back
Sunday, November 23, 2020
“No amount of experimentation can ever prove me right; a single experiment can prove me wrong.” ~ Albert Einstein
Introduction
Almost twenty days have passed since Election day, a President-Elect has been called by most networks and the Associated Press, and the country is finally moving on. However, we are taking the time to evaluate our model, understand its shortcomings and propose ways to further develop it for use in future elections.
Model and Prediction Recap
Our model relies on three different parts:
(a) an initial prediction of candidates’ popular vote share based on a weighted model of poll ranking and a decay-over-time effect for each poll’s impact on the final result,
(b) a probabilistic model that predicts the popular vote share using turnout estimates based on the age of the population, the popularity of mail-in and early voting, and the COVID-19 spread in the state, and
(c) an ensemble of the two predictions to correct the probabilistic model’s uncertainty and tie everything back together to produce the final result.
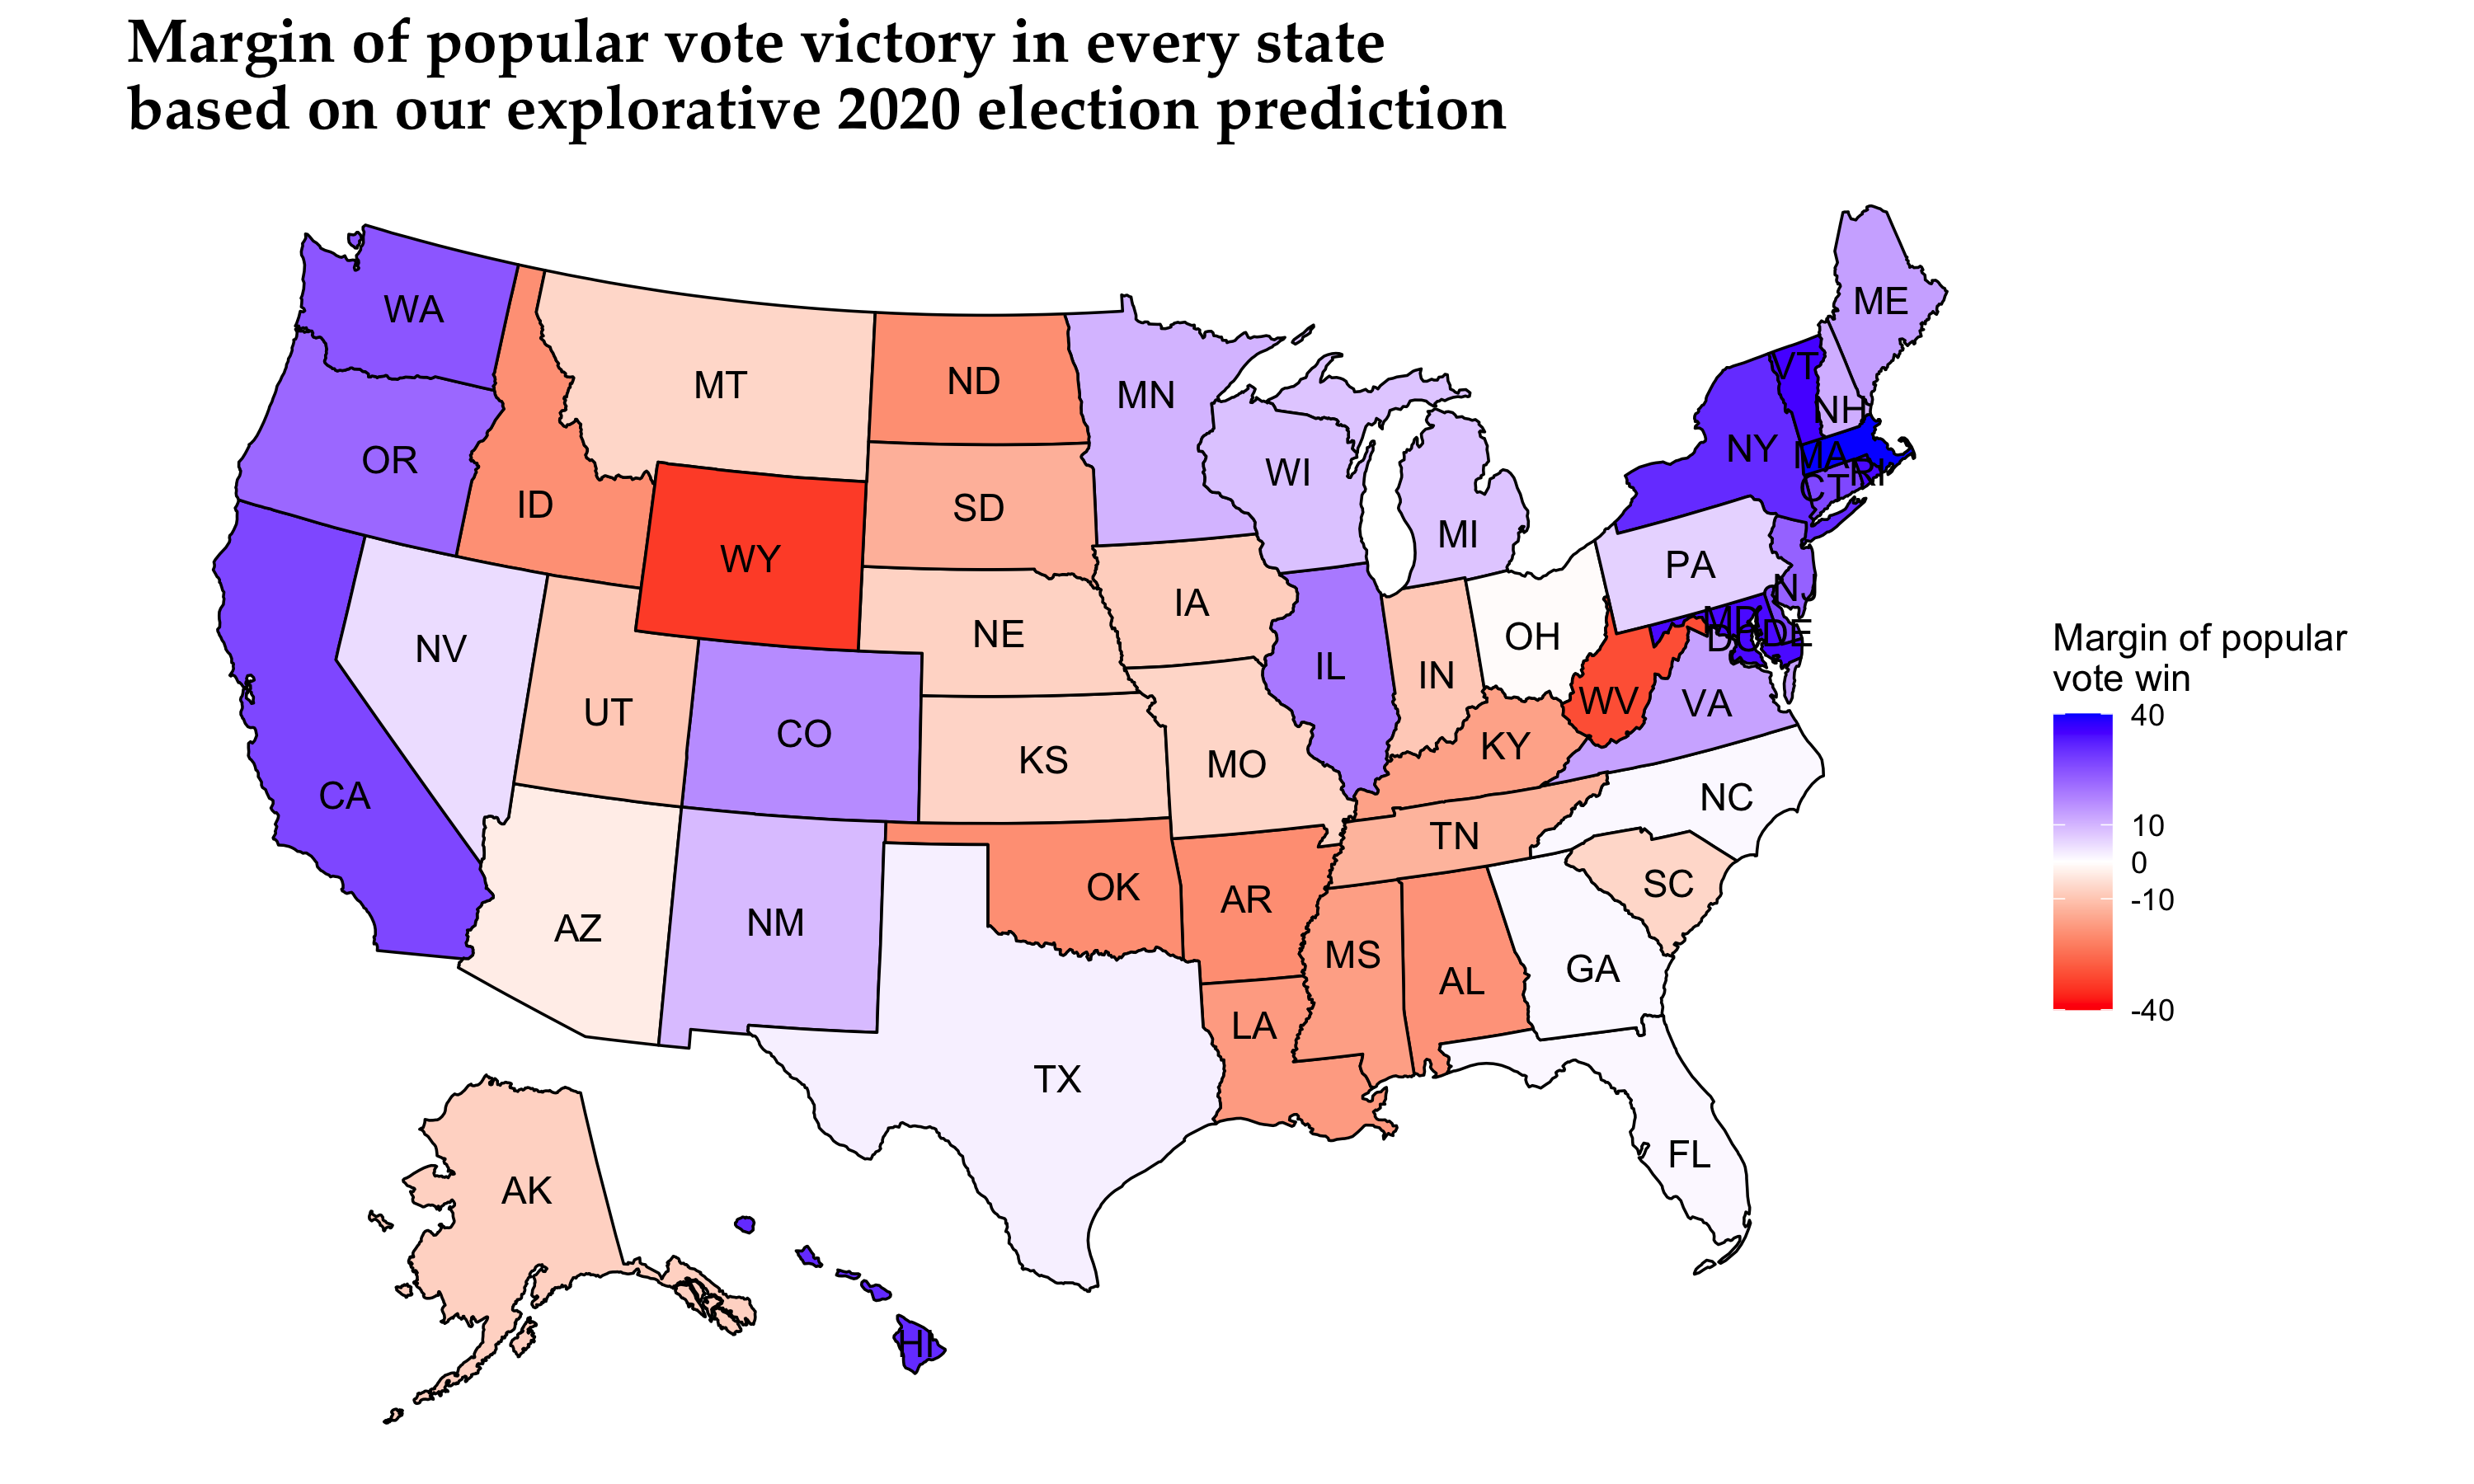
We used two different wight sets for the final ensemble model that led us to a conservative and an explorative model, based on how much weight we placed on the probabilistic model compared to the poll ranking and a decay-over-time effect model. The prediction results for the two models are presented below.
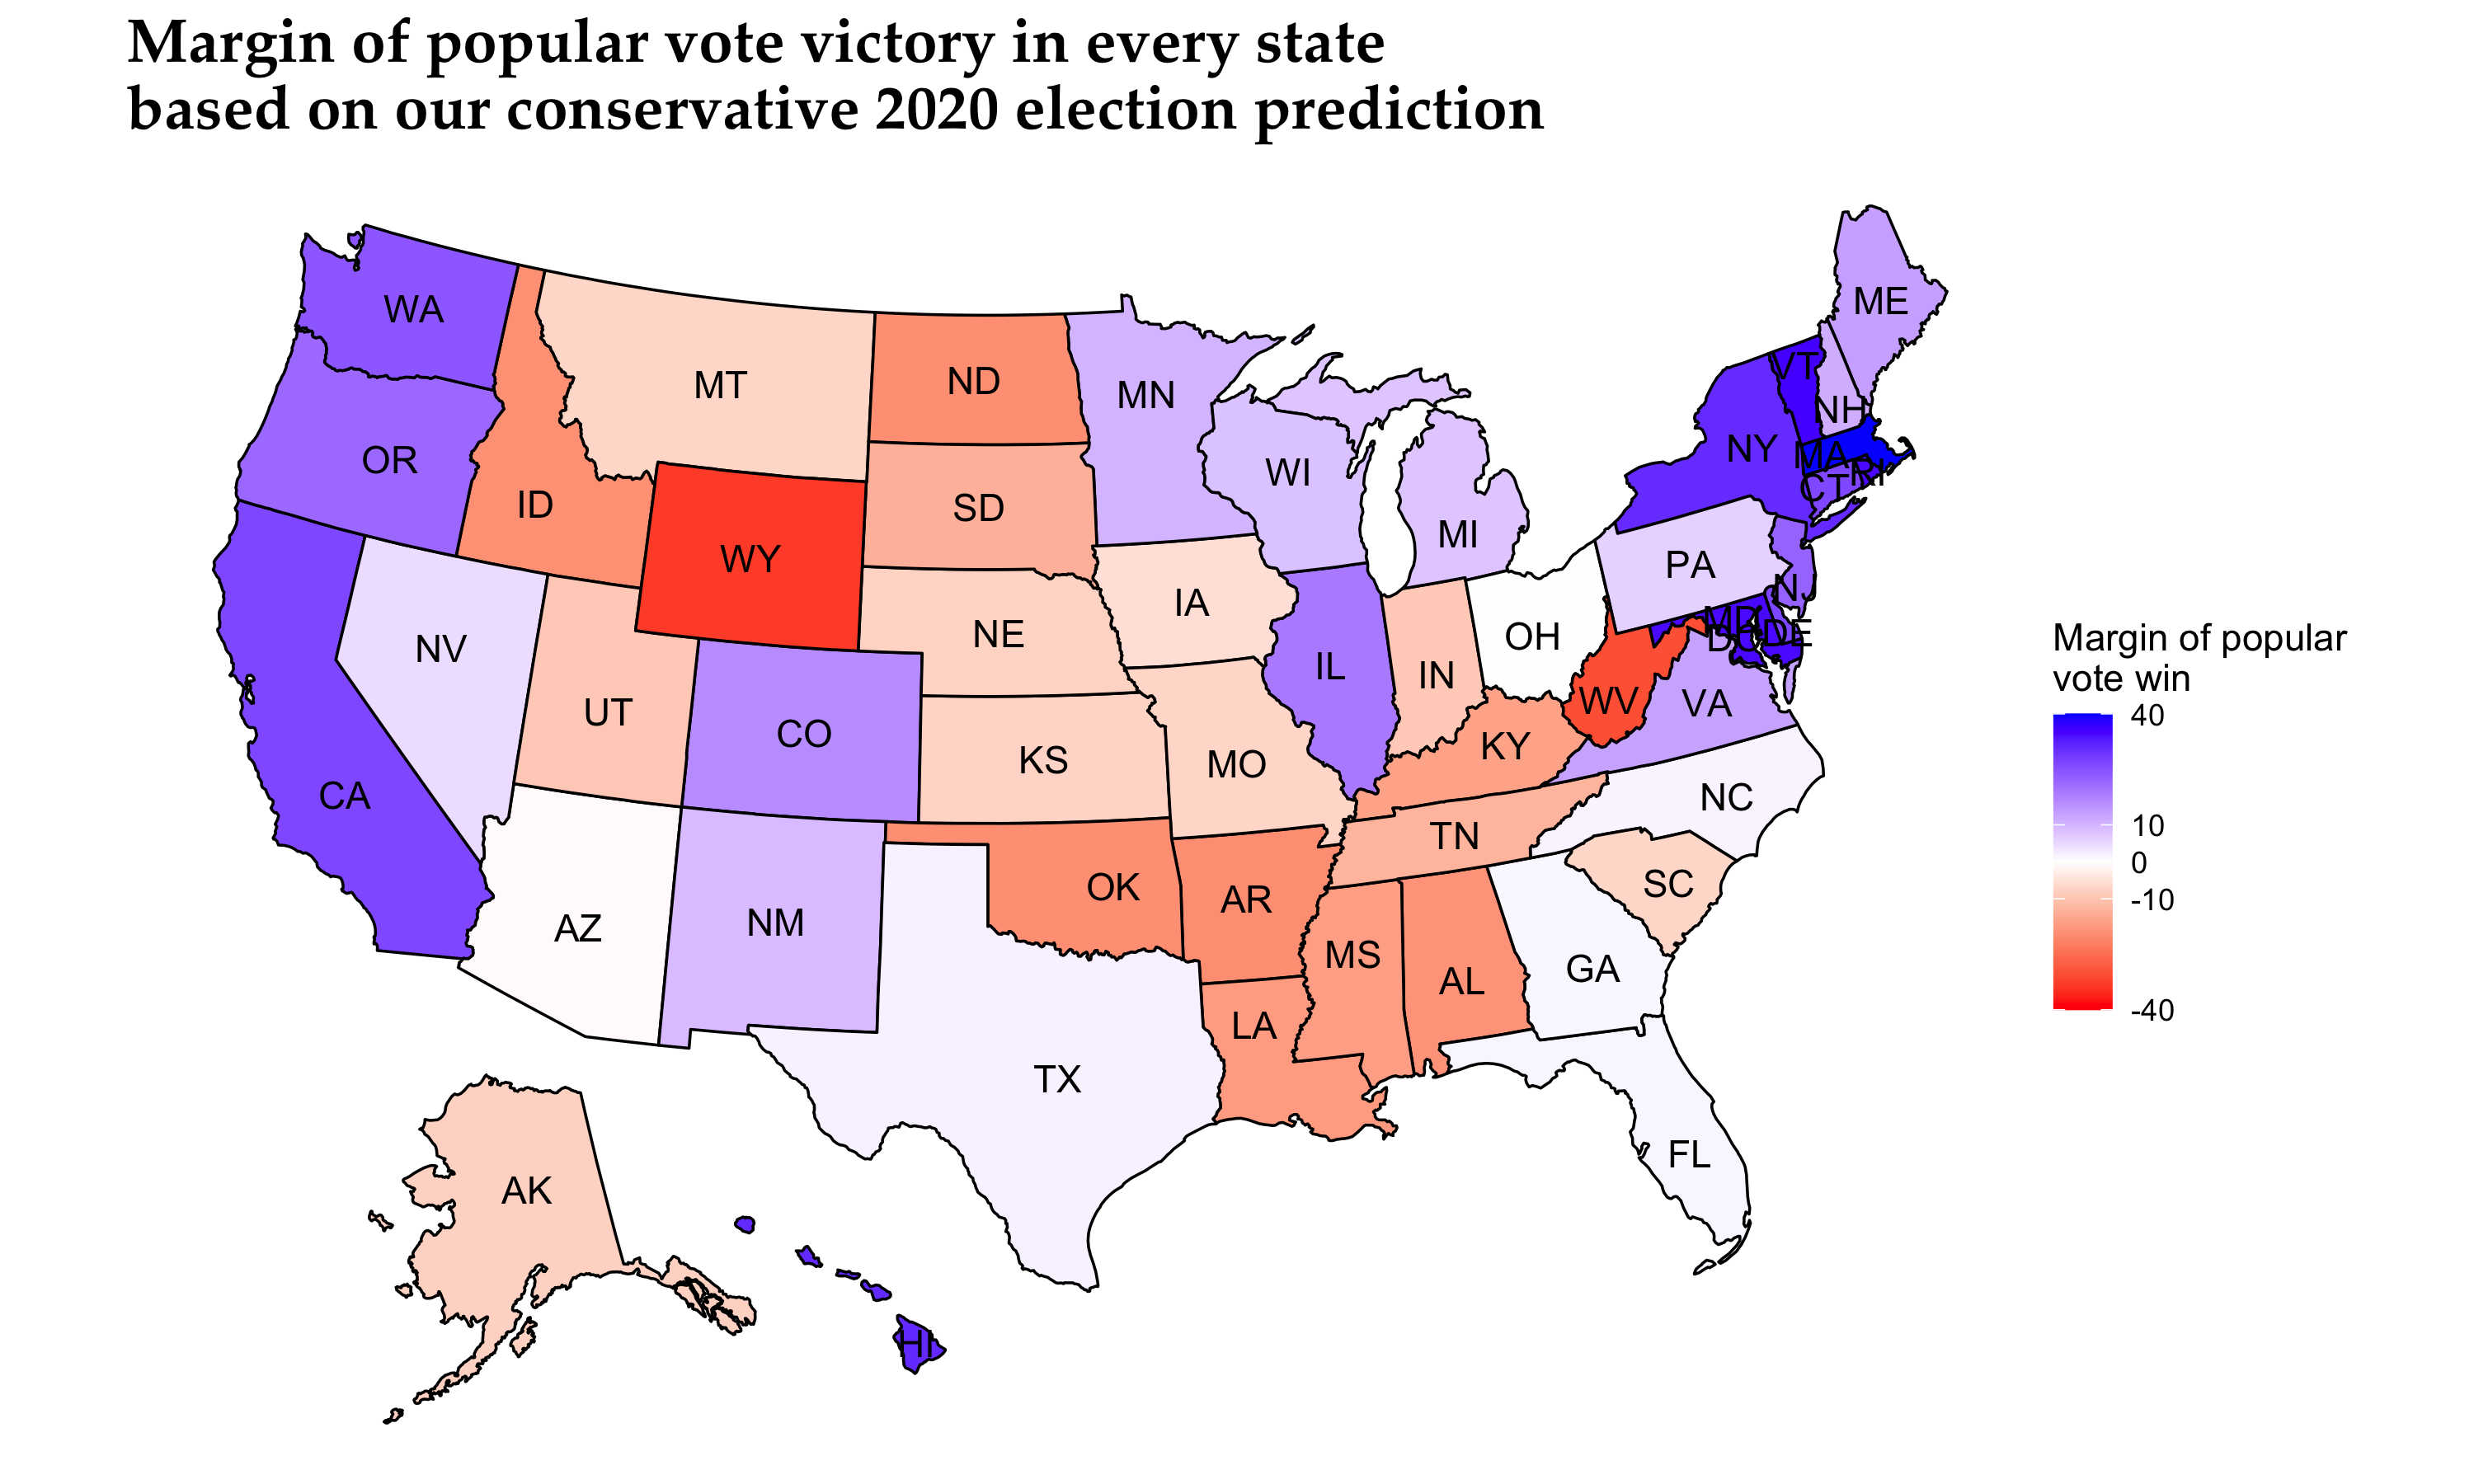
For simplicity and clarity, we report the following Electoral College vote counts based on our two models:
| Model | Democratic Electoral College vote count | Republican Electoral College vote count |
|---|---|---|
| Conservative | 311 | 226 |
| Explorative | 308 | 229 |
In the general sense, our model predicts the electoral vote share result quite close to FiveThirtyEight’s Biden win prediction (Biden: 348 electoral votes, Trump: 190 electoral votes), a little more conservatively nonetheless.
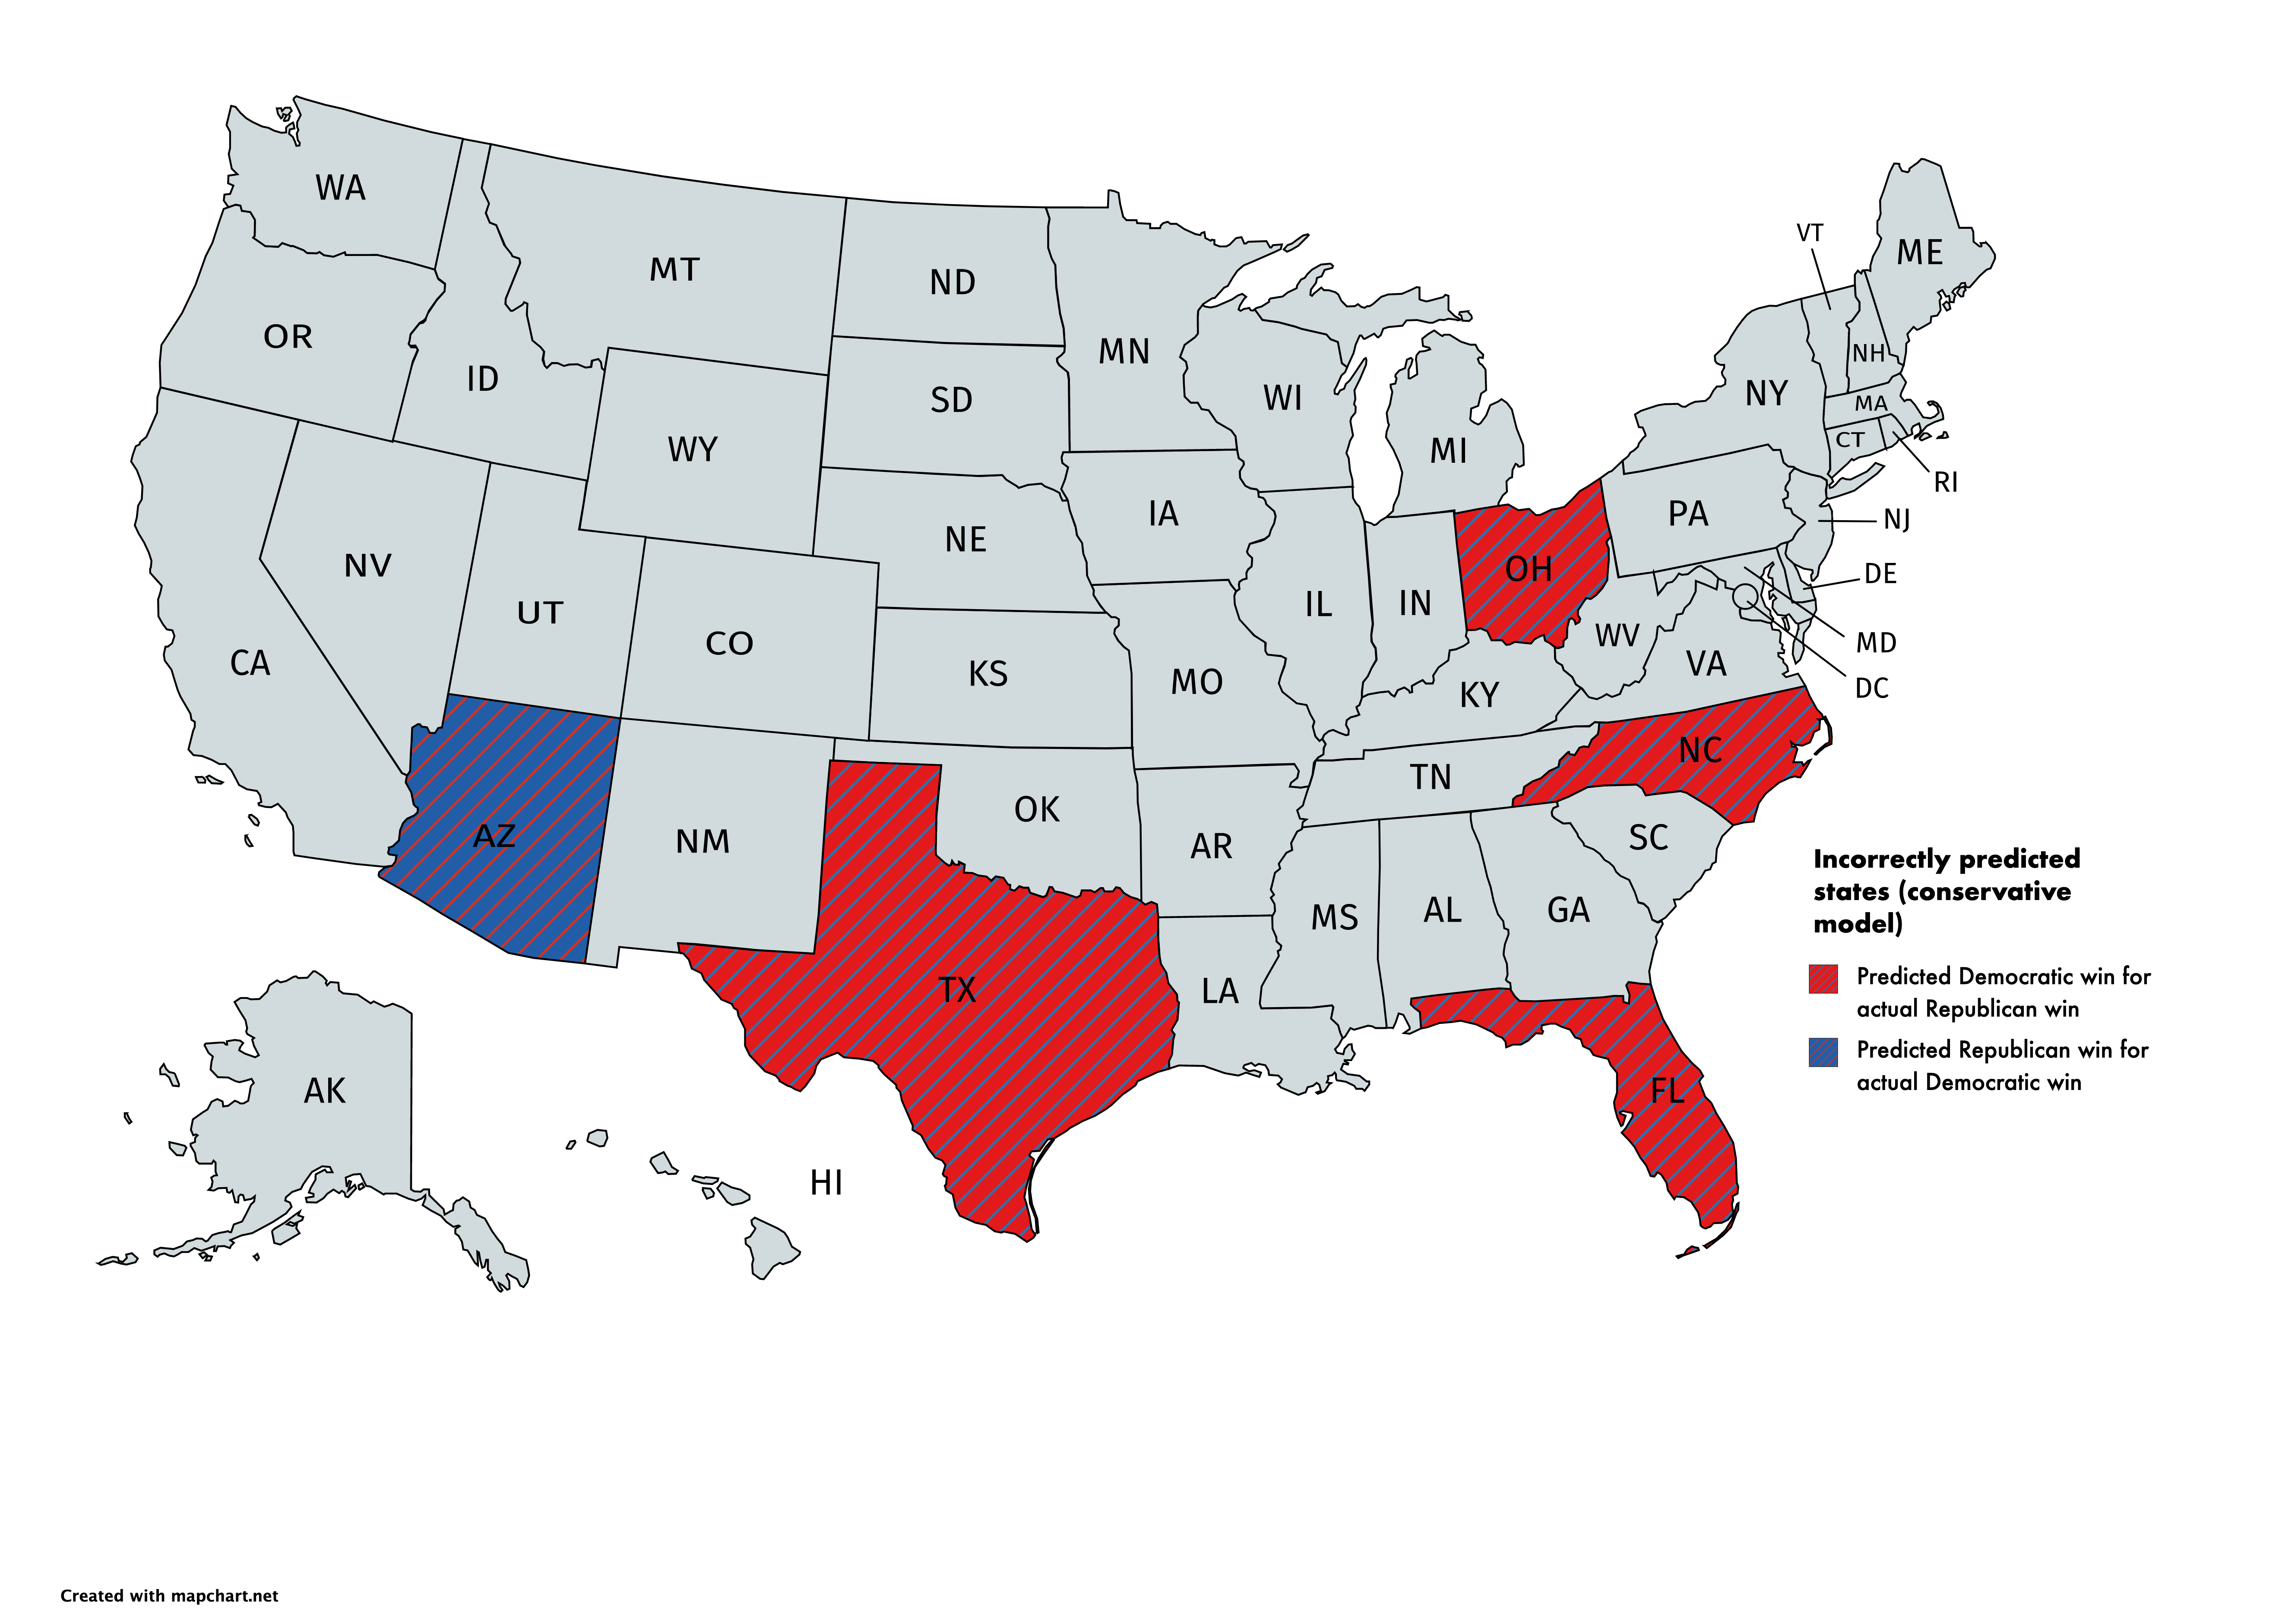
Model Accuracy
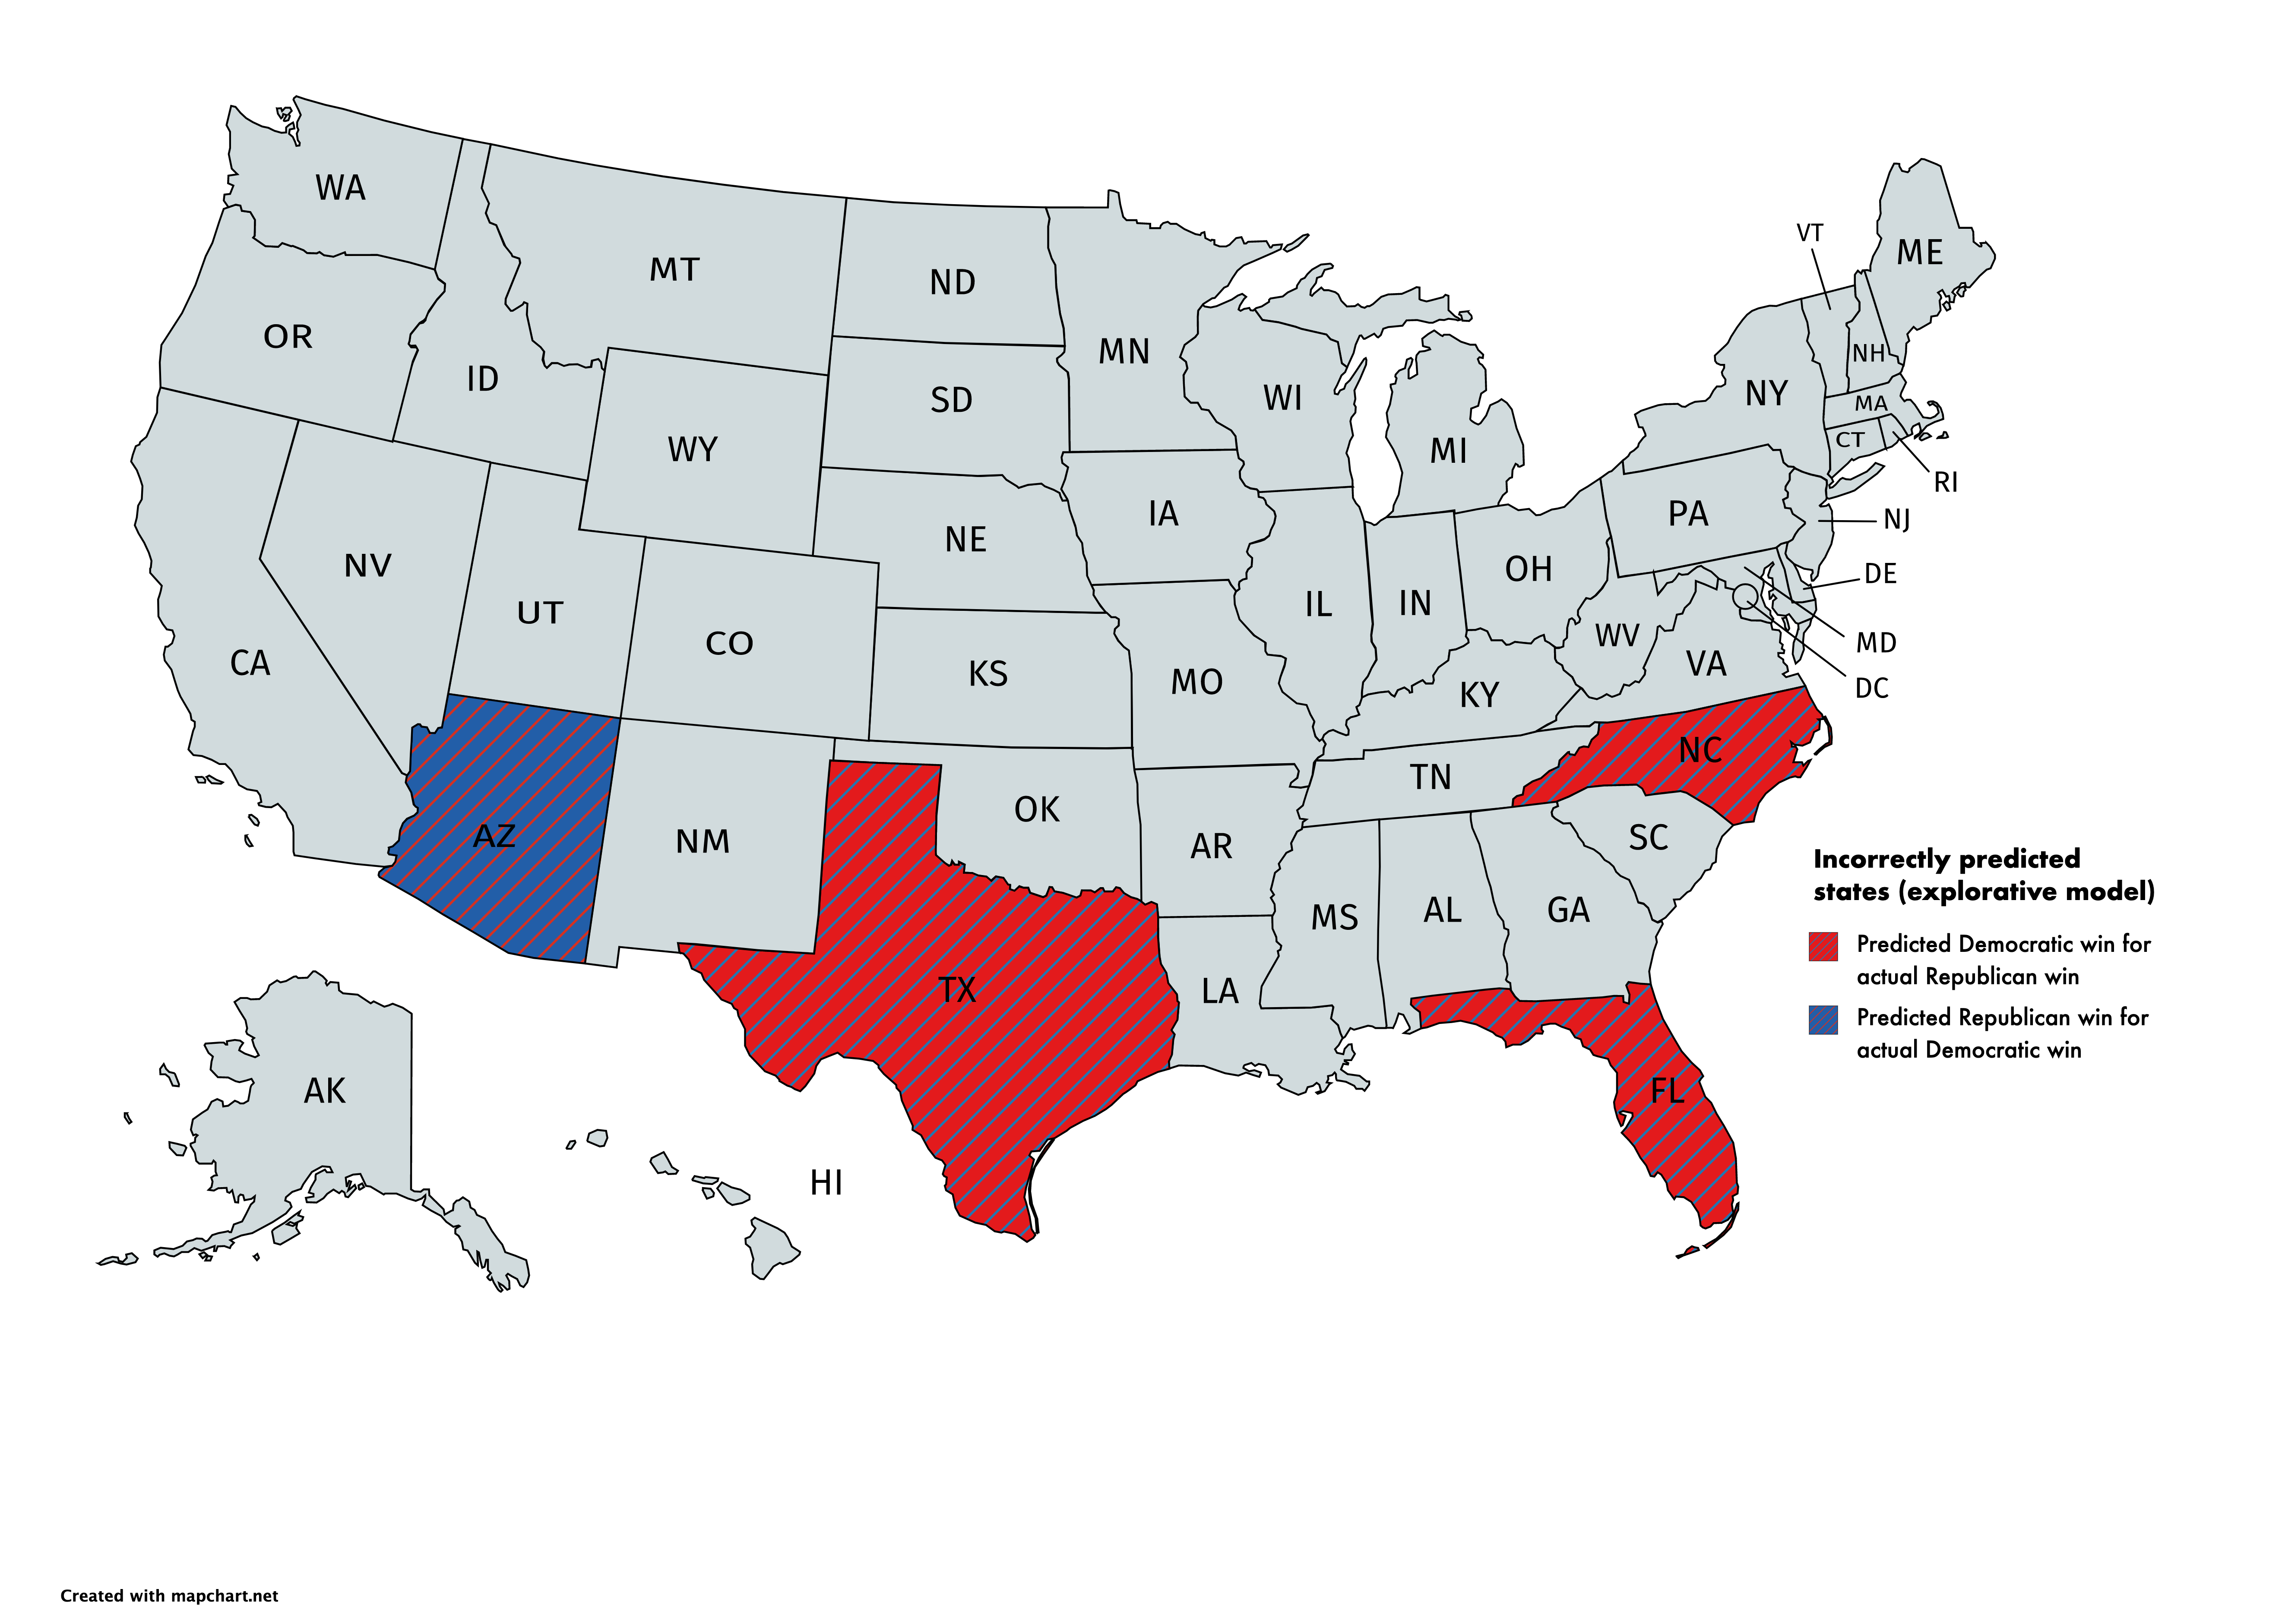
Our model proved to be quite reliable in predicting the winner in most states. In particular the conservative model incorrectly predicted the following states: Arizona, Florida, North Carolina, Ohio, and Texas. Our explorative model correctly predicted Ohio bringing the number of incorrectly predicted states down to four. The maps below summarize the results.
We turn to the non-battleground state prediction (we defined battleground states as those which our model predicted a difference of less than 6 percentage points), where our model predicted every state winner accurately. However, taking a look at the margins of vote share prediction errors we observe that in many non-battleground states the actual error is quite high in the underestimation direction. That means that states voted either more Democratic or Republican than our model predicted. Results are summarized in the map below. Please note that because of the slow vote tabulation in the state of New York, results may not be representative.
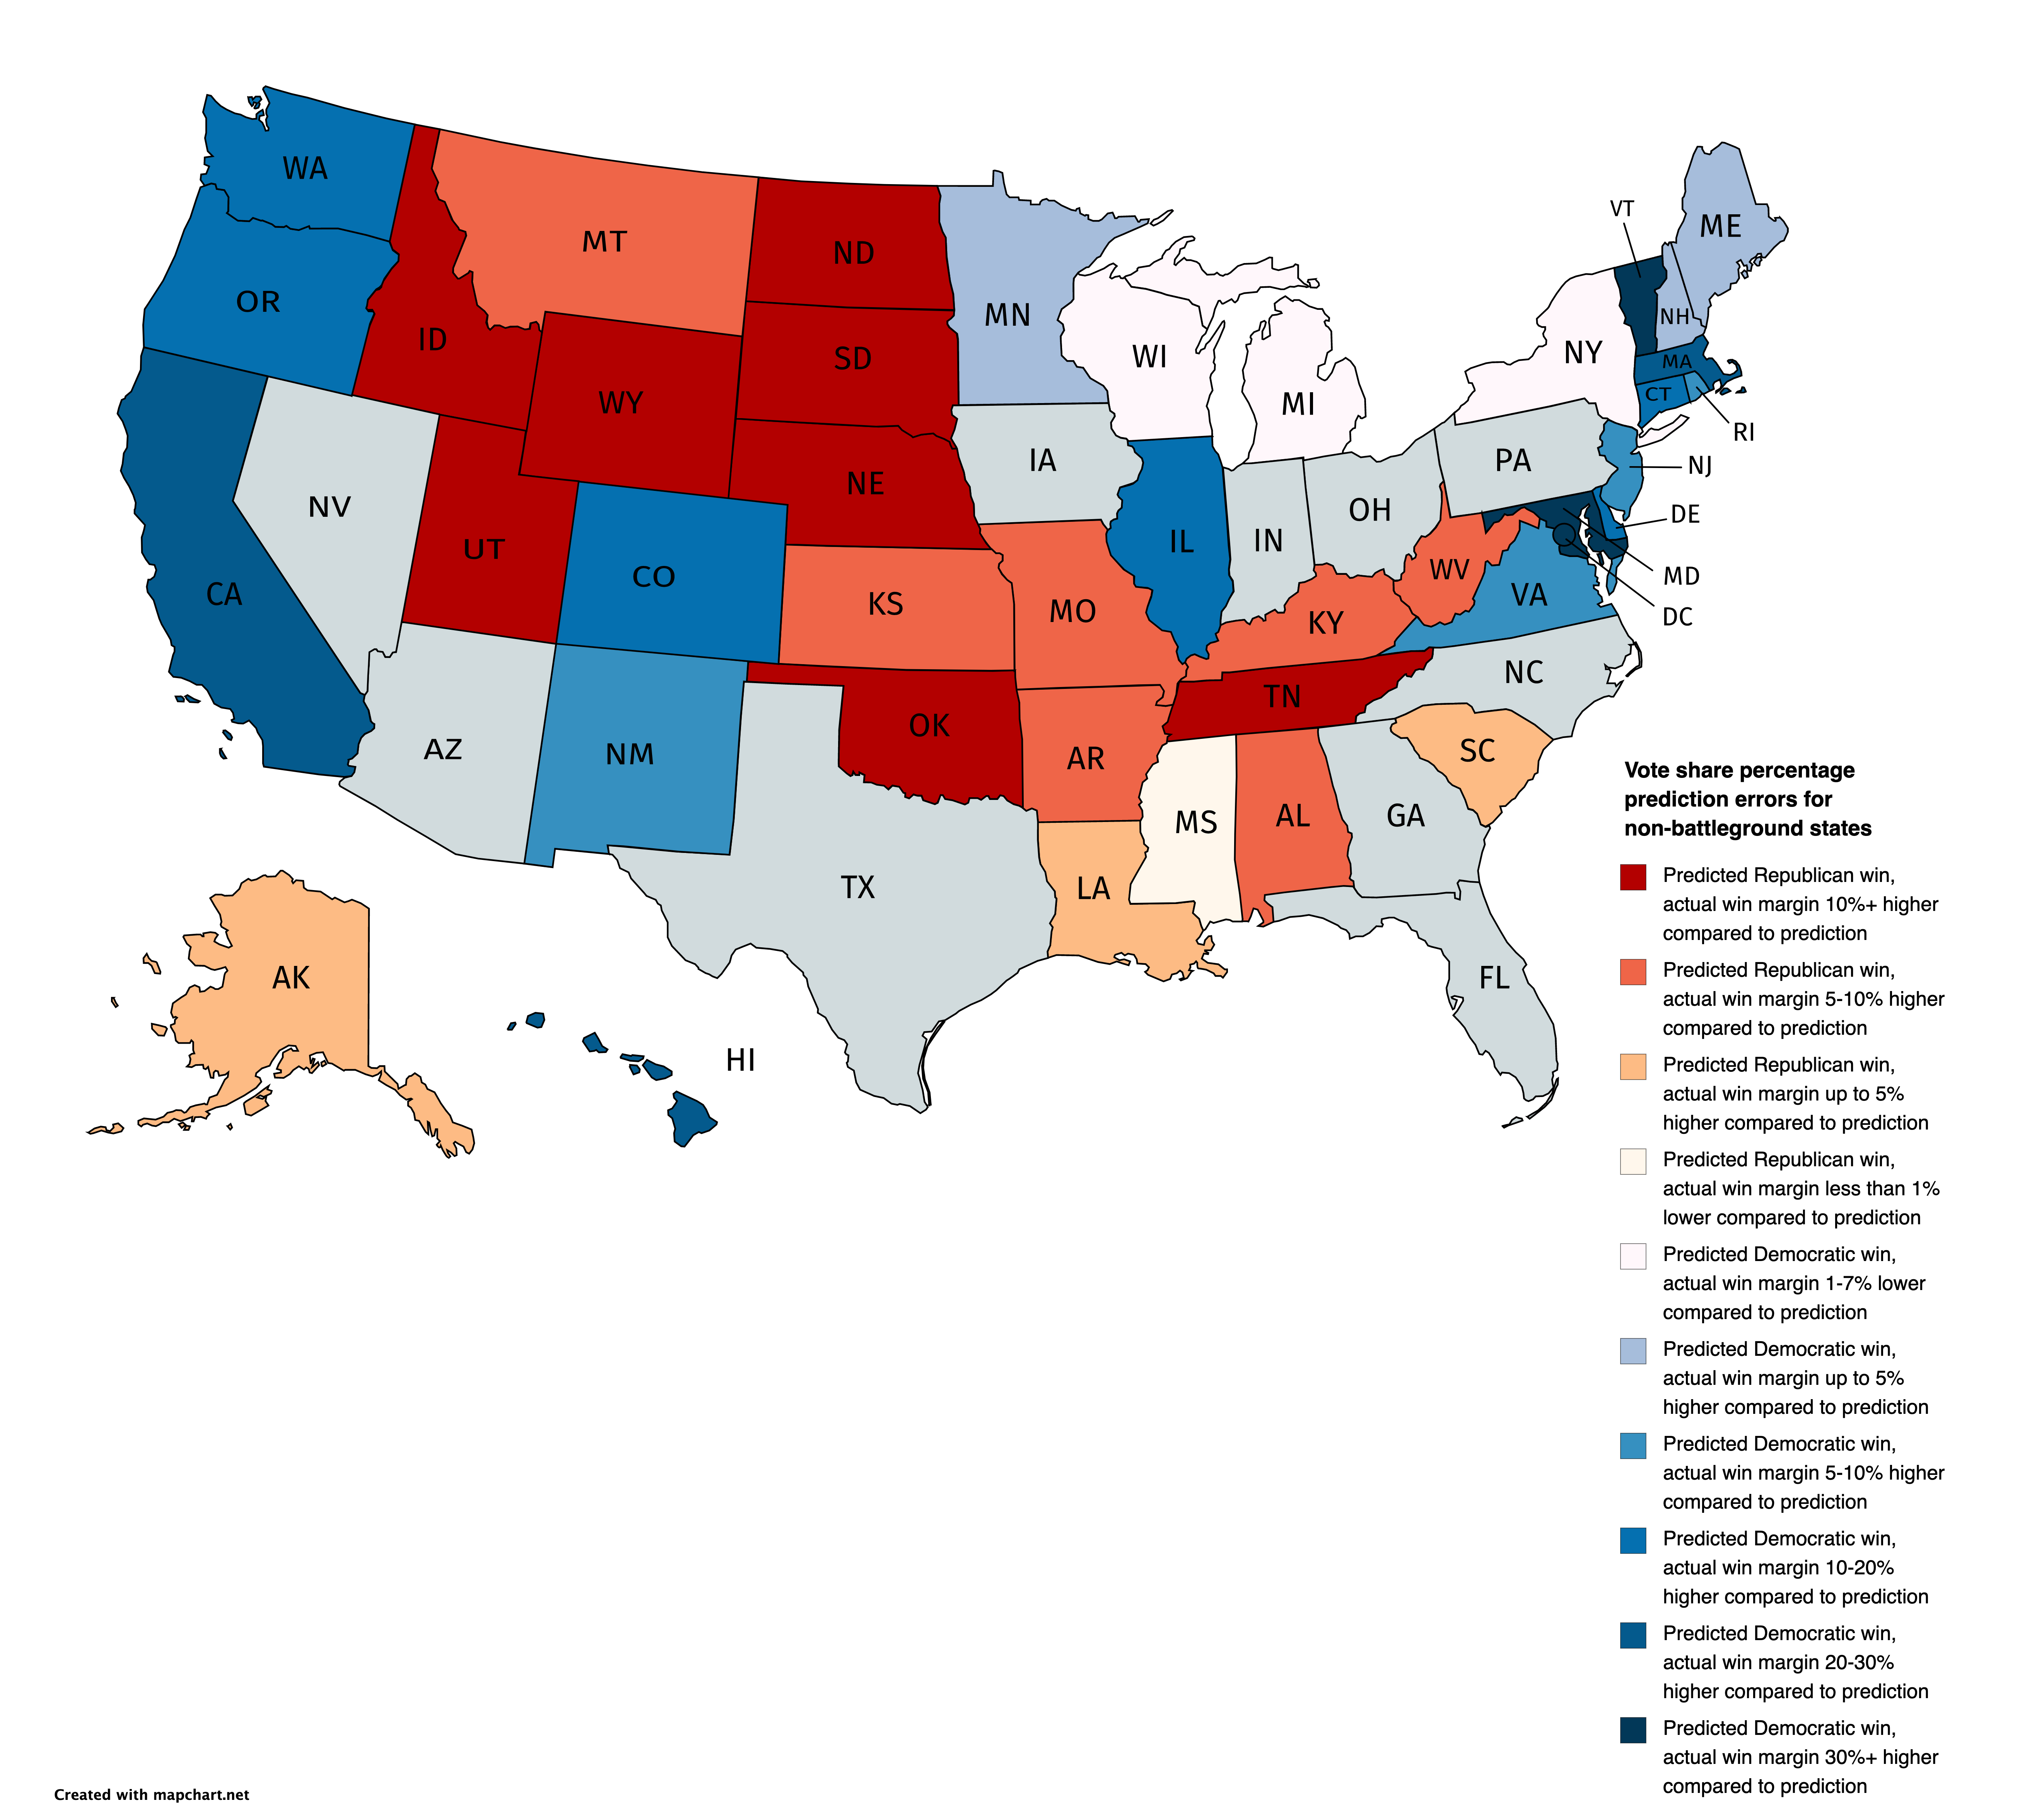
Our map shows that we underestimated Democratic states much more than Republican states, as no state won by the Republican candidate had a negative difference with the actual vote share result of more than 14 percentage points. Seven Democratic stronghold states were in that category. What is more, we also overestimated the dominance of the Democratic candidate in three states, including Wisconsin and Minnesota of the “Blue Wall”.
What went wrong: possible hypotheses
To begin with, the great disparity between the predicted and actual vote share of winners in non-battleground states shows the polarization that exists in the country, but our polling model was not able to capture completely. Remember, that in the non-battleground states, we only used our polling model. What is more, many of the battleground states that we missed appeared to have unique circumstances that rendered this election year much different (e.g. the Cuban-American voter “migration” to the Republican party in Florida, or the strong performance by Democrats in suburban areas around the country).
Based on the discussion above we can hypothesize that reasons that the model was unsuccessful in some states, including reasons that affected the voting population, but we did not address include:
(a) The ideological divide in the country and within states grew larger in the last few years and the polls were not able to capture that.
(b) Democratic voters, including first time voters that found the polls to be inaccessible in the past, were drawn to polls in unprecedented numbers using mail-in and absentee voting options. The polls were not able to capture that movement.
(c) There was a racial and demographic change in the party composition of the two main contenders that the polls missed.
(d) COVID-19 impacted Democratic voters more than Republican voters in states, including the effects of cabin fever.
(e) President Trump’s COVID-19 handling, the adherence to public safety protocols and the election integrity debate increased turnout. Our model overestimated the effect of COVID-19 for voters, either Democratic (who voted using absentee voting), or Republicans (who were not scared off the polls by COVID-19 cases, but rather energized by voter fraud claims).
Testing our Hypotheses
To test our hypotheses, we could perform the following tests (the ordering follows the hypotheses listing above):
(a) Looking at the exit poll data on ideological adherence and party voted in every state and comparing them to registration party totals and opinion surveys over the last few election cycles. If we see significant shifts, this could be one of the reasons that our model was wrong in some states. However, we should be mindful that exit polls may not capture the full scope of mail-in voters, especially if primarily performed on-site on Election Day, so results might not be representative.
(b) Many states offer statistics on voter registration and mail-in voting. We could look into how many first-time voters voted absentee or in-person, as well as their political affiliation. We could also take a look at social media and how many people mentioned that they voted for the first time in this election cycle, even though they were registered in other elections.
(c) Once again, looking at exit polls is a great indicator, but we could also look at demographic shifts in communities with strong shifts in voting, such as southern Florida. A better understanding of those dynamics would inform our poll weighting model, in that we could better recognize how representative the polling sample is, and weight each poll accordingly.
(d) We could look at states that have the highest daily averages in COVID-19 cases and deaths, as long as the policy moves in each state (business closures, curfews, etc.). In that way, Republican-led states that did not enforce harsh rules might have performed better economically (e.g., no business closures mean more revenue for businesspeople), and that might have boosted the Republican election performance. To verify that, we could look at unemployment and income to spend figures for those states.
(e) We could look at people’s opinions on how dangerous the virus is and the integrity of the election in different states and see how that translates in their political beliefs and the final election result. Nonetheless, the strongest performance test would be the actual voter turnout. We could look at our total predicted voter turnout that our model generated and compare it to the one actual turnout. Should we have a negative difference between the predicted and actual turnout, we might have overestimated the effect of COVID-19 and/or underestimated the easy of mail-in voting that 1 in 2 Americans preferred.
Onwards: Changes and Calibrations
Taking into account all that was said before, our revised model could include some of the following features, keeping in mind the danger of overfitting:
-
population dynamics and socioeconomic condition analysis based on the recent American Communities Survey data in comparison to other recent elections.
-
weighting the effect of main-in, absentee and early voting more than the discouragement of people voting by COVID-19 cases.
-
including public opinion and previous studies of political beliefs and COVID-19 information and public policy in each state to offset the regression toward the mean effect for solid Democratic or Republican states observed.
-
looking at the methods of polls to provide a more well-rounded poll-ranking based on how representative their sample was, and including 2016 election results in the analysis, especially for non-battleground states.